
SPI-based assessment of precipitation whiplash and its relationship with winter wildfire damage area in South Korea
 ; Hwang, Jinhoo**
; Yoo, Youngjae**
; Lee, Sangwook***
; Jeong, Siwon***
; Kim, Yoojun***
; Jeon, Seongwoo****, †
; Hwang, Jinhoo**
; Yoo, Youngjae**
; Lee, Sangwook***
; Jeong, Siwon***
; Kim, Yoojun***
; Jeon, Seongwoo****, †
Abstract
Precipitation whiplash, defined as a rapid transition between anomalously wet and anomalously dry conditions, has emerged as an important hydroclimatic extreme under climate change, with potential implications for wildfire activity. Although previous studies have linked precipitation whiplash to wildfire regimes in arid and semi-arid regions, its occurrence and impacts in monsoon-dominated East Asia remain poorly understood. This study investigated the occurrence of precipitation whiplash across South Korea and examined its relationship with interannual variability in winter wildfire damage. Using a high-resolution (500 m) daily precipitation dataset derived from multi-source observational data provided by the Korea Meteorological Administration, Standardised Precipitation Index (SPI) values were calculated at one-month (SPI1) and three-month (SPI3) timescales. Precipitation whiplash events were identified using SPI-based thresholds, including moderate (+/-1) and extreme (+/-1.6) definitions. In addition, a persistence-weighted whiplash intensity metric was developed to integrate anomaly magnitude and temporal reinforcement. National wildfire-damaged area from January to March during 2001–2016 was used to assess climate–fire relationships. The results showed that precipitation whiplash occurred recurrently across South Korea, with substantial interannual variability in both spatial extent and intensity. Pearson correlation analysis revealed positive associations between winter wildfire-damaged area and whiplash indicators, with the strongest relationship observed for the spatial extent of extreme short-term whiplash (SPI1-Whiplash1.6; r = 0.806). Moderate positive correlations were also found for SPI1-Whiplash1, SPI3-Whiplash1, and national mean persistence-weighted whiplash intensity. These findings indicate that extreme, spatially extensive wet-to-dry transitions are closely linked to increased winter wildfire damage in South Korea, highlighting precipitation whiplash as a relevant climate-based indicator for wildfire risk assessment in monsoon-influenced regions.
Keywords:
Hydroclimatic Extremes, Climate Variability, Climate-Fire Interaction, Wildfire Risk Assessment, Climate Change Impacts1. Introduction
Precipitation whiplash refers to the rapid transition between extremely wet and extreme dry conditions occurring within short time periods, typically between consecutive seasons (Swain et al., 2018). Previous research defined whiplash as an abrupt hydroclimatic shift driven by anomalies in atmospheric circulation and moisture transport patterns (Swain et al., 2025), indicating its close link to climate variability and extreme weather events. A growing body of evidence shows that precipitation whiplash events are becoming more frequent and intense under anthropogenic climate change as global warming amplified hydroclimatic instability (Loecke et al., 2017; Luo et al., 2025; Puxley and Martin, 2025; Tan et al., 2023). Such rapid fluctuations-from anomalously wet summers to anomalously dry winters-pose significant challenges to flood management, agricultural planning, and wildfire management (Liu and Basso, 2020; Puxley et al., 2024; Tan et al., 2023).
Importantly, recent studies highlight that precipitation whiplash can influence wildfire regimes. Swain et al. (2025) have reported associations between whiplash-driven fuel accumulation during wet periods and heightened fire susceptibility during subsequent droughts, suggesting that extreme seasonal reversals may intensify wildfire frequency and severity.
Despite growing international attention, whiplash behaviour in South Korea remains under-explored. South Korea exhibits a strong monsoonal climate, where sharp wet-dry transitions may significantly alter vegetation moisture, fuel dynamics, and ultimately wildfire risk. However, few studies have assessed long-term precipitation whiplash patterns in this region or examined their relationship with wildfire damage.
Therefore, this study investigates whether precipitation whiplash occurred across South Korea over the last two decades using high-resolution grid precipitation data. Furthermore, the study evaluates whether inter-annual whiplash variability is associated with the extent of winter wildfire damage. By integrating climate indices and disaster statistics, this research provides new empirical evidence on climate-driven wildfire vulnerability in monsoon-dominated landscapes. The findings aim to contribute to the limited literature on hydroclimatic extremes in East Asia while informing wildfire risk management.
2. Material and methods
2.1. Material
This study utilised daily precipitation data from the Korea Meterological Administration (KMA). The dataset consists of daily accumulated precipitation with a spatial resolution of 500 m, covering the entire land area of South Korea. The fine spatial resolution allows for detailed identification of localised hydroclimatic extremes and supports grid-based detection of precipitation whiplash events. Using this dataset, the calendar month Standardised Precipitation Index (SPI) was calculated.
Second, statistical records of wildfire-damaged area were obtained from Korean Statistical Information Service (KOSIS). The dataset includes monthly burned area for January-March from 2001 to 2016, corresponding to the dry and wildfire-prone season in South Korea.
2.2. Methods
The Standardised Precipitation Index (SPI) is a widely used statistical indicator designed to quantify precipitation anomalies across multiple temporal scales. SPI expresses deviations of observed precipitation from the long-term climatological mean in units of standard deviation, allowing wet and dry conditions to be compared consistently across different regions and climates (McKee et al., 1993; Naresh Kumar et al., 2009). According to Mullens and Engström (2025), SPI is one of the most used precipitation indices for identifying precipitation whiplash.
Daily precipitation values were aggregated into monthly totals for each 500 m grid cell. Using these monthly precipitation series, the SPI was calculated for each months. In this research, two SPI timescales were considered to capture precipitation anomalies operating at different temporal scales. SPI at a one-month timescale (SPI1) was used to represent short-term moisture variability, which is closely related to rapid changes in surface soil moisture and immediate vegetation growth conditions (Hua et al., 2019). In addition, SPI at a three-month timescale (SPI3) was employed to characterise seasonal-scale precipitation anomalies, which is an adequate indicator for monsoon regions (WMO, 2012).
SPI values were calculated by fitting a gamma distribution to long-term precipitation records for each grid cell and subsequently transforming the cumulative probability to a standard normal distribution with a mean of zero and unit variance. This standardisation allows precipitation anomalies to be compared consistently across time and space (Martinez-Villalobos and Neelin, 2019).
Precipitation whiplash was defined as an abrupt transition from anomalously wet summer conditions in year prior to anomalously dry winter conditions in the subsequent year. Whiplash events were detected independently for each 500 m grid cell using SPI-based thresholds designed to capture rapid seasonal reversals in precipitation extremes.
A first, moderate-intensity definition (SPI1-Whiplash1) was based on SPI1. Under this criterion, a grid cell was classified as experiencing precipitation whiplash when at least one month during the summer (June to August) of year n exhibited SPI1 ≥ +1, followed by at least one month during the winter (January to March) of year n+1 with SPI1 ≤ -1. These thresholds are consistent with standard definitions for meteorological drought and pluvial conditions (He and Sheffield, 2020). To examine more extreme hydroclimatic transitions, a stricter definition (SPI1-Whiplash1.6) was also considered, raising the SPI1 thresholds for summer and winter anomalies to ±1.6, respectively. This threshold aligns with the classification for ‘extreme drought’ utilised by the U.S. Drought Monitor and has been adopted in a recent study to identify rapid seasonal reversals in precipitation extremes (Chen and Ford, 2023).
In addition to monthly anomalies, precipitation whiplash was evaluated at the seasonal scale using SPI3. In this case (SPI3-Whiplash1), whiplash events were identified when the summer SPI3 in year n exceeded +1 and the winter SPI3 in year n+1 fell below -1, thereby capturing sustained seasonal moisture anomalies that may not be evident at shorter timescales.
To better capture the severity of precipitation whiplash beyond instantaneous anomaly contrasts, this study developed a persistence-weighted whiplash intensity metric that integrates both anomaly magnitude and temporal persistence (Eq. 1). This approach is conceptually motivated by previous study of Tan et al. (2023) emphasising that the impacts of hydroclimatic extremes depend not only on the magnitude of wet-dry contrasts but also on how persistently such transitions occur.
| (1) |
Building upon SPI1-based whiplash detection, persistence was quantified by summing the number of summer months (June to August) in year n with SPI1 values exceeding +1 and the number of winter months (January to March) in year n+1 with SPI1 values below -1. This sum was then normalised by the total number of months (six months), representing the maximum possible duration of anomalous conditions across the wet-to-dry transition period. This normalisation transforms the persistence term into a dimensionless ratio (ranging from 0 to 1), allowing for direct comparison of relative temporal persistence across grid cells and years. A value close to 1 indicates that wet and dry anomalies were sustained throughout most of the transition period, whereas lower values represent more intermittent or short-lived anomalies. Thus, the persistence term reflects the relative duration of anomaly conditions rather than their absolute length, ensuring that the metric captures the degree of temporal reinforcement independent of the fixed seasonal window. Rather than treating whiplash as a binary event, this formulation allows stronger weight to be assigned to grid cells experiencing more sustained anomalies.
To incorporate anomaly magnitude, the persistence weight was multiplied by the SPI1 range, defined as the absolute difference between the maximum SPI1 value of wet period and minimum SPI1 value of dry period. This formulation ensures that the whiplash intensity increases only when both strong anomaly contrast and sustained duration co-occur, thereby capturing the compound nature of hydroclimatic transitions.
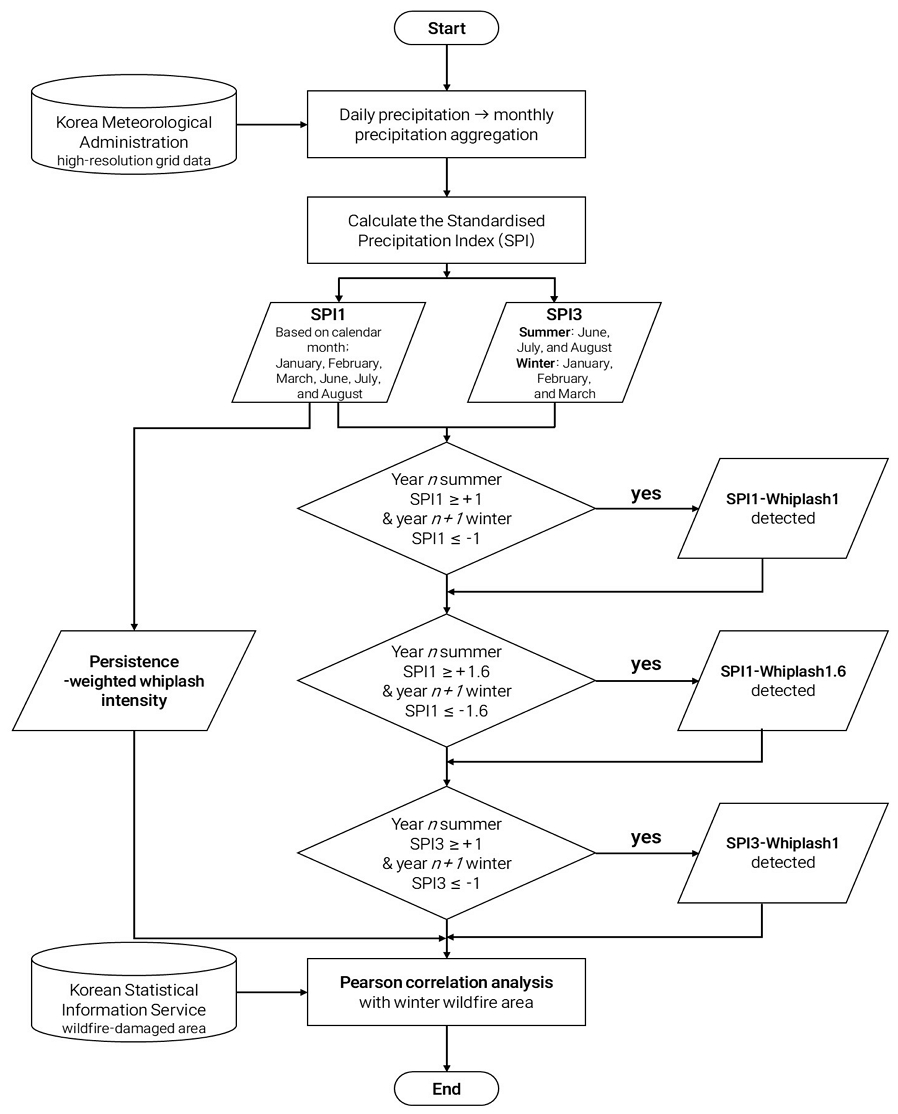
Flowchart describing the process of this study. See text for details
Annual precipitation whiplash indicators were derived to quantify interannual variability in both the spatial extent and intensity of precipitation whiplash across South Korea. For each year, the spatial extent of whiplash was represented by the total area of grid cells identified as experiencing precipitation whiplash under each SPI-based detection scheme, including SPI1-Whiplash1, SPI1-Whiplash1.6, and SPI3-Whiplash1. This measure reflects the proportion of the land area affected by rapid wet-to-dry transitions in a given year.
In addition to spatial extent, overall whiplash severity was characterised using the mean persistence-weighted whiplash intensity. This indicator was calculated by averaging grid level persistence-weighted whiplash intensity scores across all land grid cells in South Korea for each year. By integrating information on both the magnitude and temporal reinforcement of precipitation anomalies, this metric provides a national scale representation of precipitation whiplash intensity.
To examine the relationship between precipitation whiplash and wildfire impacts, Pearson correlation analysis was performed between precipitation whiplash indicators and winter wildfire-damaged area, defined as the total burned area during the January to March period. This period also overlaps to the wildfire occurring season in South Korea.
Pearson correlation analysis was employed to quantify the strength and direction of relationships between interannual variability in precipitation whiplash indicators and winter wildfire-damaged area. This method evaluated the degree to which two continuous variables co-vary over time, providing a straightforward measure of association between climate-driven hydroclimatic extremes and wildfire impacts.
3. Results
3.1. Temporal characteristics of SPI-based precipitation anomalies
The calculation of SPI1 and SPI3 revealed substantial interannual variability in precipitation conditions across South Korea during the study period (Fig. 2, Fig. 3). Fig. 2 and Fig. 3 present spatial distributions for selected years (2001, 2002, 2004, and 2011), which were identified as years with consistently large whiplash-affected areas across multiple whiplash definitions. In contrast, SPI3 is more suitable for representing seasonal-scale precipitation conditions, as it integrates short-term variability and emphasises sustained moisture anomalies during the summer monsoon period (June to August) and the winter dry season (January to March)
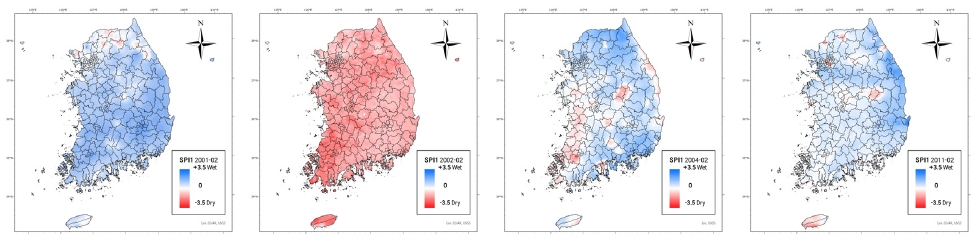
Spatial distribution of SPI1 for February (2001, 2002, 2004, 2011)
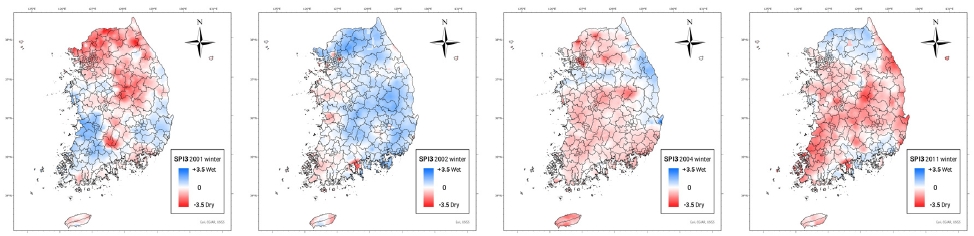
Spatial distribution of SPI3 for winter three months (2001, 2002, 2004, 2011)
3.2. Detection of precipitation whiplash events
SPI-based whiplash detection confirmed that wet-to-dry precipitation whiplash events occurred repeatedly across South Korea. Under the SPI1-Whiplash1 definition, whiplash events were detected in multiple years, indicating that moderate wet-to-dry transitions are relat.ively common at the monthly scale (Fig. 4). The stricter SPI1-Whiplash1.6 criterion identified fewer events, reflecting the lower frequency of extreme whiplash transitions but highlighting years characterised by particularly strong precipitation contrasts (Fig. 5).
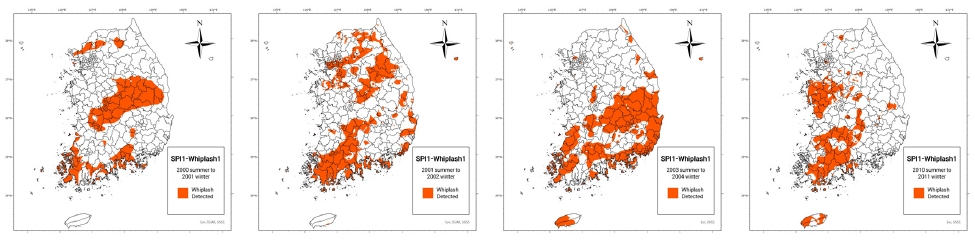
Spatial distribution of detected SPI1-Whiplash1 event during the transition from summer to winter (2001, 2002, 2004, 2011)
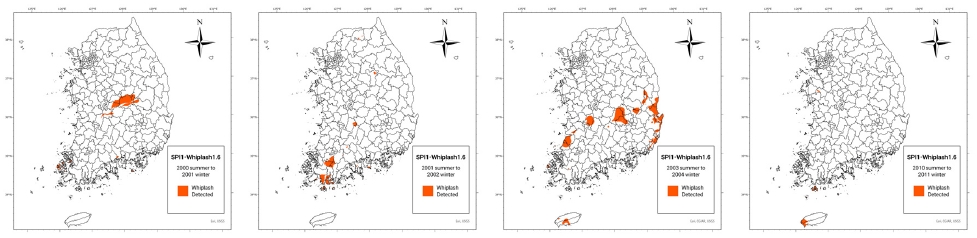
Spatial distribution of detected SPI1-Whiplash1.6 event during the transition from summer to winter (2001, 2002, 2004, 2011)
SPI3-Whiplash1 detection further demonstrated that seasonal-scale whiplash events also occurred (Fig. 6), although with different temporal patterns compared to SPI1-based detections. These results suggest that precipitation whiplash manifests at both short-term and seasonal timescales.
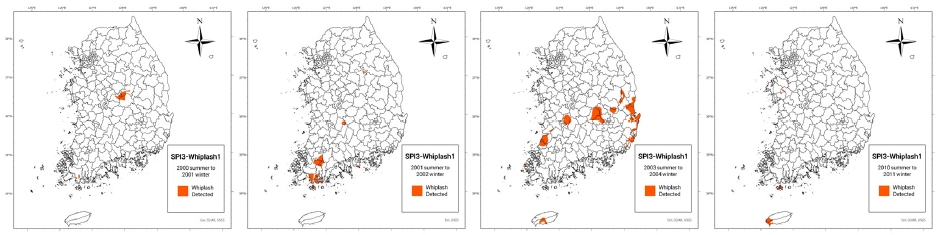
Spatial distribution of detected SPI3-Whiplash1 event during the transition from summer to winter (2001, 2002, 2004, 2011)
3.3. Spatial extent of whiplash-affected areas
The spatial extent of precipitation whiplash exhibited pronounced interannual variability across South Korea during the 2001–2016 period when referenced to the winter season of year n+1 (Table 1). Under the SPI1-Whiplash1 definition, the whiplash-affected area ranged widely form relatively limited extents (e.g., approximately 1,884 km2) to years with extensive coverage exceeding 36,000 km2. Several years were characterised by particularly large whiplash-affected areas, indicating that moderate short-term wet-to-dry transitions can occur over substantial portions of the national territory.

Area affected by precipitation whiplash
In contrast, the SPI1-Whiplash1.6 definition, which captures more extreme precipitation whiplash events, identified markedly smaller affected areas overall. For most years, the spatial extent of extreme whiplash remained below 1,000km2, and in several years no grid cells satisfied the extreme threshold. However, specific years showed pronounced expansions in affected area, with values exceeding 3,000–7,000 km2. These episodic increases suggest that although extreme precipitation whiplash events are less frequent, they can still manifest over spatially extensive regions under favourable climatic conditions.
Seasonal-scale whiplash detected using the SPI3-Whiplash1 definition exhibited a different spatial pattern. The whiplash-affected area varied from near-zero values in some years to maxima exceeding 10,000 km2. Compared to SPI1-based detections, the SPI3-Whiplash1 definition detected a relatively smaller area. This indicates that intra-seasonal variations might have cancelled each other out, leading to more moderate SPI3 values.
The ranking of years with the largest whiplash-affected areas differs depending on the SPI timescale and threshold applied. For SPI1-Whiplash1, the five years with the greatest affected areas were 2004, 2002, 2001, 2012, and 2011. Under the stricter SPI1-Whiplash1.6 definition, the top five years were 2004, 2011, 2015, 2001, and 2002, suggesting that extreme monthly-scale whiplash events occurred most prominently in a partially overlapping but distinct set of years. In contrast, SPI3-Whiplash1 identified 2004, 2012, 2014, 2015, and 2003 as the years with the largest affected areas, reflecting the influence of sustained seasonal percipitation anomalies. Notably, while 2004 consistently appears across all definitions, other years vary depending on the temporal scale and threshold, highlighting that different aspects of hydroclimatic variability are captured by each whiplash indicator.
Taken together, these results demonstrate that the spatial footprint of precipitation whiplash in South Korea depends strongly on both the anomaly threshold and the temporal scale considered. While SPI1-Whiplash1 captures widespread but moderate wet-to-dry transitions, SPI1-Whiplash1.6 isolates rarer yet potentially more impactful extreme events with limited coverage compared to SPI1-Whiplsh1. In contrast, SPI3-Whiplash1 reflects seasonal-scale precipitation conditions, which leads to differences in whiplash detection patterns compared to SPI1-based results. Because SPI3 integrates precipitation anomalies over a three-month period, short-term wet or dry anomalies may be smoothed out, resulting in some grid cells where whiplash is not detected despite being identified under SPI1-based criteria. Conversely, in cases where wet or dry conditions persist throughout an entire season, SPI3 can identify whiplash events in grid cells that were not detected under SPI1, as the seasonal signal becomes sufficiently strong. These differences indicate that SPI3-based detection is more sensitive to sustained seasonal conditions, whereas SPI1-based detection captures more transient, short-term variability.
3.4. Persistence-weighted whiplash intensity
The persistence-weighted precipitation whiplash intensity exhibited substantial interannual variability across South Korea during the 2001–2016 period (Fig. 7). This metric was designed to integrate both the magnitude of wet-to-dry precipitation contrasts and the temporal reinforcement of anomalies, thereby capturing the severity of precipitation whiplash beyond simple occurrence or spatial extent.
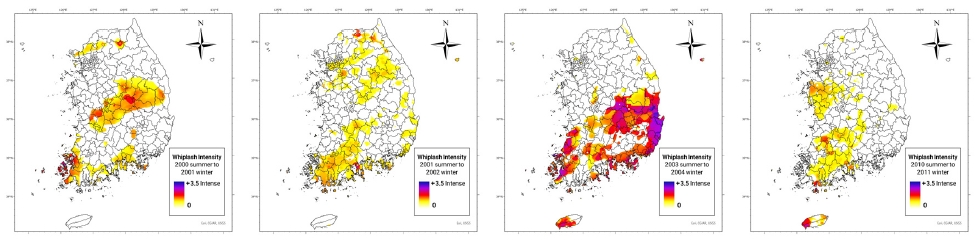
Spatial distribution of persistence-weighted whiplash intensity during the transition from summer to winter (2001, 2002, 2004, 2011)
To represent national-scale exposure, the persistence-weighted whiplash intensity was averaged across all land grid cells of South Korea border, assigning a value of zero to cells without detected whiplash event. This spatially comprehensive averaging approach reflects the combined influence of anomaly magnitude, temporal persistence, and spatial coverage. This formulation emphasises that national-scale whiplash intensity is governed by the integrated effects of anomaly strength and affected area proportion, making it particularly suitable for evaluating large-scale ecological and wildfire response.
3.5. Relationship between precipitation whiplash and wildfire damage
The results of whiplash affected areas and correlation analysis are illustrated schematically in Fig. 8. Pearson correlation analysis indicates that winter wildfire-damaged area exhibits consistent positive associations with the areal extent of precipitation whiplash, although the strength of association varies by SPI timescale and anomaly threshold. Using whiplash-affected area (km2) as the predictor, the correlation with January to March wildfire damage is positive and moderate for SPI1-Whiplash1 (r = 0.599) and SPI3-Whiplash1 (r = 0.579). In contrast, the strict extreme-threshold definition SPI1-Whiplash1.6 shows a strong positive association with wildfire-damaged area (r = 0.806). These results demonstrate that years with larger spatial footprints of short-term wet-to-dry extreme whiplash tend to coincide with larger winter burned areas.
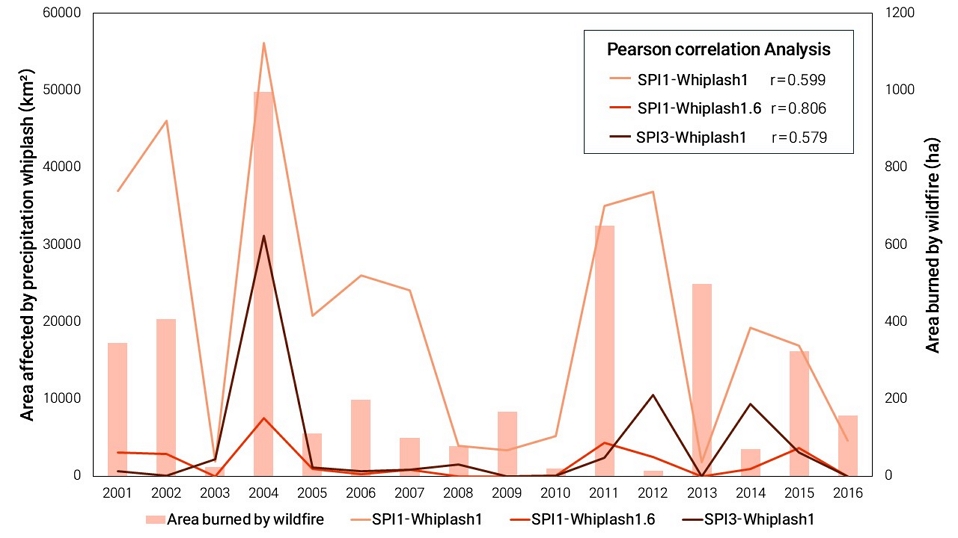
Time series of precipitation whiplash affected areas and wildfire burned areas (2001–2016)
The similar magnitudes of correlation for SPI1-Whiplash1 and SPI3-Whiplash1 suggest that both short-term and seasonal-scale whiplash conditions capture meaningful interannual variability related to wildfire impacts. However, the substantially stronger relationship observed for SPI1-Whiplash1.6 implies that the spatial coverage of extreme wet-to-dry transitions at the monthly scale is especially relevant to explaining winter wildfire damage variability. One plausible interpretation is that extreme monthly-scale reversals are more directly linked to the conditions that govern winter fire outcomes, such as rapid desiccation of fine fuels, short-term depletion of moisture reservoirs, and heightened susceptibility to fire spread under atmospheric conditions.
Importantly, the whiplash–fire relationship strengthens when moving from moderate thresholds (+/-1) to extreme thresholds (+/-1.6). This pattern indicates that the wildfire signal is not simply responding to whether whiplash occurred somewhere, but rather to whether the whiplash transition reached a level of severity that is climatically and ecologically consequential. From a hazard perspective, the SPI1-Whiplash1.6 metric may function as an indicator of years in which a large portion of the landscape experienced highly anomalous wet conditions followed by highly anomalous dry conditions across the critical seasonal transition. This sequence can be consistent with a “fuel build-up then fuel drying” pathway: wet summers can promote vegetation growth and litter production, while subsequent dry winters facilitate fuel curing and flammability, increasing the potential for large burned areas once ignitions occur. The wet-then-dry sequencing mechanism has been highlighted in climate–fire literature as a driver of enhanced fire activity under compound hydroclimatic variability (Puxley et al., 2024).
Notably, during 2012–2014, wildfire-damaged area did not consistently track the interannual variability of SPI-based whiplash-affected area. This discrepancy suggests that climate-driven wet-to-dry transitions alone may not fully explain wildfire damage variability in those specific years.
Given that the majority of wildfires in South Korea are caused by human activities, with dominant causes including unintended fires by visitors (29.7%) and agricultural burning (22.3%), as well as other accidental ignitions such as discarded cigarettes (Nam, 2026), precipitation whiplash should not be interpreted as a direct driver of fire ignition, but rather as a factor influencing pre-fire fuel conditions, thereby leading to magnification of the fire. Wet conditions associated with whiplash can enhance vegetation growth and fuel accumulation; however, in the absence of immediate fire events, this accumulated biomass may persist into subsequent years. When ignition eventually occurs, such carryover of fuel may contribute to increased wildfire damage.
This mechanism implies a potential lagged effect, whereby the influence of precipitation whiplash extends beyond the year of occurrence through interannual fuel accumulation. However, this interpretation remains hypothetical and requires further validation using longer-term datasets and spatially explicit fire occurrence records.
In addition to spatial extent, this study evaluated whether winter wildfire-damaged area covaries with national mean precipitation whiplash severity derived from the persistence-weighted intensity metric. The national mean persistence-weighted intensity and winter wildfire-damaged area are shown in Fig. 9.
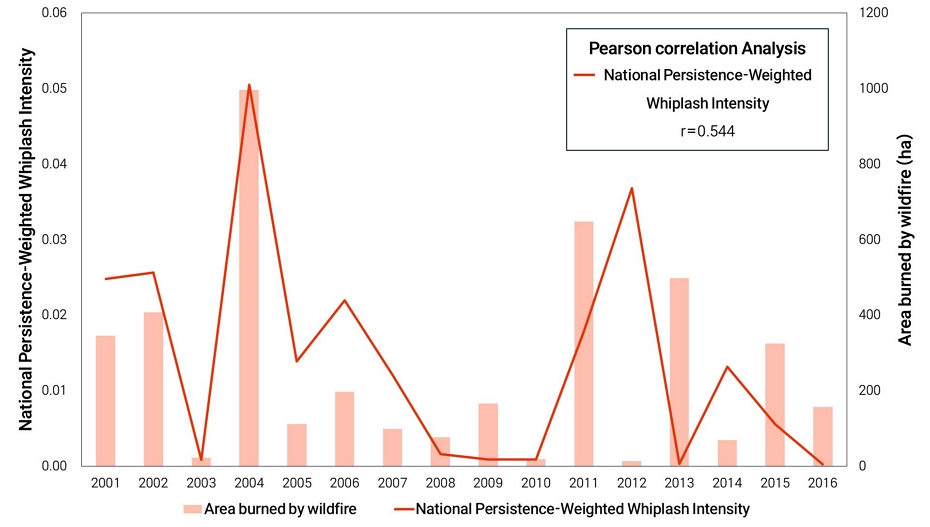
Time series of national persistence-weighted whiplash intensity and wildfire burned areas (2001–2016)
The correlation coefficient (r = 0.544) indicates that years with higher national mean persistence-weighted intensity show a moderate positive correlation with larger winter wildfire-damaged area. However, this relationship is weaker than the strongest area-based result (SPI1-Whiplash1.6; r = 0.806). This contrast suggests that the spatial footprint of extreme whiplash explains wildfire damage variability more strongly than the national mean intensity score alone. One possible explanation is that national averaging-particularly when computed as a single scalar over the entire country-can dilute localised high-intensity signals that may strongly influence wildfire outcomes at regional scales.
A similar discrepancy was observed during 2012–2014, when wildfire-damaged area did not align with the whiplash indicator. This pattern is consistent with the deviation ideentified in Section 3.5.1. for SPI-based whiplash extent. The recurrence of this inconsistency across both area-based and intensity-based metrics suggests that additional factors which were not considered in this study may have exerted a stronger influence on wildfire-damaged area during those years.
4. Discussions
4.1. Precipitation whiplash and its linkage to winter wildfire damage in South Korea
This study provides empirical evidence that precipitation whiplash occurs recurrently across South Korea, and that such hydroclimatic behaviour is meaningfully associated with interannual variability in winter wildfire damage. Among the examined indicators, the spatial extent of extreme short-term whiplash, captured by the SPI1-Whiplash1.6 definition, exhibited the strongest positive association with winter wildfire-damaged area. This suggests that wildfire damage in South Korea is particularly sensitive to years in which extreme wet–to-dry transitions occur over large portions of the landscape, rather than to moderate or purely seasonal-scale anomalies alone.
A plausible mechanistic interpretation is that anomalously wet summer conditions promote vegetation growth and fuel accumulation, while subsequent abrupt transitions to anomalously dry winter conditions facilitate rapid fuel curing and desiccation. This sequence can substantially increase fuel flammability, thereby amplifying wildfire damage once ignition occurs. The comparatively weaker correlations observed for SPI3-based whiplash suggest that cumulative seasonal anomalies, while relevant, may be less effective in capturing the rapid moisture reversals that directly condition winter fire behaviour. Together, these results highlight the importance of short-term hydroclimatic variability and extreme transition intensity in shaping wildfire outcomes.
4.2. Implications for wildfire risk assessment and policy
The findings of this study indicate that precipitation whiplash indicators can complement traditional drought metrics in wildfire risk assessment. In particular, the strong association between extreme SPI1-based whiplash extent and winter wildfire damage suggests that monitoring rapid wet-to-dry transitions may provide early insight into years with elevated wildfire vulnerability. The persistence-weighted whiplash intensity metric further offers a means of integrating anomaly magnitude and temporal reinforcement, capturing aspects of hydroclimatic stress that are not reflected in single-threshold indicators.
From a policy perspective, incorporating precipitation whiplash metrics into seasonal outlooks or early warning frameworks could enhance preparedness and resource allocation for wildfire management, especially during the winter fire season. Such indicators may be particularly valuable for identifying years in which climate-driven background conditions elevate the potential severity of wildfire impacts, even in regions like South Korea where ignition is predominantly induced by anthropogenic influence.
5. Conclusions
In conclusion, this study demonstrates that precipitation whiplash is a recurrent hydroclimatic phenomenon across South Korea and that it is significantly associated with interannual variability in winter wildfire damage. Extreme short-term whiplash events, as represented by SPI1-Whiplash1.6, show the strongest relationship with wildfire impacts, underscoring the role of rapid wet–dry transitions in amplifying wildfire risk. These findings emphasise the value of precipitation whiplash as a climate-based indicator for wildfire vulnerability assessment and highlight its potential application in climate adaptation and disaster risk reduction strategies.
This study does not come without limitations. The study relied on national-scale wildfire damage statistics and did not explicitly evaluate the spatial correspondence between whiplash-affected areas and actual wildfire locations. Thus, future research integrating geographically referenced wildfire occurrence data would enable more detailed spatial attribution.
Acknowledgments
This work was supported by Korea Environment Industry &Technology Institute (KEITI) through “Climate Change R&D Project for New Climate Regime.”, funded by Korea Ministry of Climate, Energy and Environment (MCEE) (RS-2022-KE002123).
References
-
Chen L, Ford TW. 2023. Future changes in the transitions of monthly-to-seasonal precipitation extremes over the Midwest in Coupled Model Intercomparison Project Phase 6 models. Int J Climatol 43(1): 255-274.
[https://doi.org/10.1002/joc.7756]

-
He X, Sheffield J. 2020. Lagged compound occurrence of droughts and pluvials globally over the past seven decades. Geophys Res Lett 47(14).
[https://doi.org/10.1029/2020GL087924]
-
Hua L, Wang H, Sui H, Wardlow B, Hayes MJ, Wang J. 2019. Mapping the spatial-temporal dynamics of vegetation response lag to drought in a semi-arid region. Remote Sens 11(16): 1873.
[https://doi.org/10.3390/rs11161873]
-
Liu L, Basso B. 2020. Impacts of climate variability and adaptation strategies on crop yields and soil organic carbon in the US Midwest. PLoS ONE 15(1): e0225433.
[https://doi.org/10.1371/journal.pone.0225433]
-
Loecke TD, Burgin AJ, Riveros-Iregui DA, Ward AS, Thomas SA, Davis CA, St. Clair MA. 2017. Weather whiplash in agricultural regions drives deterioration of water quality. Biogeochemistry 133(1): 7-15.
[https://doi.org/10.1007/s10533-017-0315-z]
-
Luo H, Nanding N, Deng F, Wu H, Huang Z, Chen J, Peng J, Zhang B. 2025. Spatiotemporal patterns in precipitation whiplash over China during 1901-2100 based on CMIP6 simulations. Environ Res Commun 7: 015014.
[https://doi.org/10.1088/2515-7620/ad97aa]
-
Martinez-Villalobos C, Neelin JD. 2019. Why do precipitation intensities tend to follow gamma distributions? J Atmos Sci 76(11): 611-3631.
[https://doi.org/10.1175/JAS-D-18-0343.1]
- Mckee TB, Doesken NJ, Kleist J. 1993. The relationship of drought frequency and duration to time scales. In Eighth Conference on Applied Climatology.
-
Mullens E, Engström J. 2025. Drought to flood to drought: A review of definitions of precipitation whiplash events, what causes them and their impacts over the continental united states. Int J Clim 45(8): e8850.
[https://doi.org/10.1002/joc.8850]
- Nam MH. 2026. 2025nyeon sanbultong-gyeyeonbo [2025 Wildfire Statistics Yearbook]. Korea Forest Service.
-
Naresh Kumar M, Murthy CS, Sesha sai MVR, Roy PS. 2009. On the use of Standardized Precipitation Index (SPI) for drought intensity assessment. Meteorol Appl 16(3): 381-389.
[https://doi.org/10.1002/met.136]
-
Puxley BL, Martin ER. 2025. A continental united states climatology of precipitation whiplash using a new event-based definition. Int J Climatol 46(3): e70223.
[https://doi.org/10.1002/joc.70223]
-
Puxley BL, Martin ER, Basara JB, Christian JI. 2024. The wildfire impacts of the 2017-2018 precipitation whiplash event across the Southern Great Plains. Environ Res Lett 19(7): 074029.
[https://doi.org/10.1088/1748-9326/ad54da]
-
Swain DL, Abatzoglou JT, Albano CM, Brunner MI, Diffenbaugh NS, Kolden C, Prein AF, Singh D, Skinner CB, Swetnam TW, Touma D. 2025. Increasing hydroclimatic whiplash can amplify wildfire risk in a warming climate. Glob Chang Biol 31(2): e70075.
[https://doi.org/10.1111/gcb.70075]
-
Swain DL, Langenbrunner B, Neelin JD, Hall A. 2018. Increasing precipitation volatility in twenty-first-century California. Nat Clim Chang 8(5): 427-433.
[https://doi.org/10.1038/s41558-018-0140-y]
-
Tan X, Wu X, Huang Z, Fu J, Tan X, Deng S, Liu Y, Gan TY, Liu B. 2023. Increasing global precipitation whiplash due to anthropogenic greenhouse gas emissions. Nat Commun 14(1): 2796.
[https://doi.org/10.1038/s41467-023-38510-9]
- World Meterological Organization. 2012. Standardized precipitation index user guide. Geneva: WMO; [accessed 2026 Jun 22]. https://library.wmo.int/viewer/39629/#page=7&viewer=picture&o=bookmarks&n=0&q=