
Estimation of carbon storage loss and its economic value caused by a megafire

Abstract
In March 2025, a megafire in Uiseong spread across five counties in Gyeongsangbuk-do and became the largest wildfire recorded in South Korea. This study presents a rapid, spatially explicit framework combining the InVEST (Integrated Valuation of Ecosystem Services and Tradeoffs) carbon storage model with remote sensing to estimate immediate wildfire-driven carbon storage loss and its economic implications. Pre-fire aboveground carbon storage was modeled with InVEST, and fire severity was classified from satellite-based relative differenced Normalized Burn Ratio (RdNBR). To account for spatial variation in fire effects, two scenarios incorporating burn-severity-dependent residual fractions were applied instead of a uniform national inventory factor. Pre-fire aboveground carbon storage was estimated at 18.6 MtC. Post-fire carbon storage loss was estimated at 3.85–5.66 MtC across the two scenarios, equivalent to a 21–30% reduction in the pre-fire stock and an average loss of 134–196 tCO2/ha across the burned area. Expressed as CO2 units from molecular-weight ratio, the storage loss reached 14.1–20.7 MtCO2, corresponding to an estimated economic value of 124–182 billion Korean Won (KRW) based on the 2025 average allowance price in the Korean Emissions Trading Scheme. This amount is equivalent to 37–55% of Korea’s annual net removals from land use, land-use change, and forestry (LULUCF) reported for 2022, indicating that a single megafire can substantially undermine national carbon-neutrality efforts. This approach provides a practical basis for damage assessment, disturbance-related carbon accounting, risk-informed restoration and carbon policy.
Keywords:
Wildfire, InVEST, Carbon Storage, Remote Sensing, Ecosystem Service, Emissions Trading Scheme1. Introduction
In March 2025, a large-scale wildfire that originated in Uiseong, Gyeongsangbuk-do spread under dry conditions, moving more than 75 km through Andong and Cheongsong before it was finally extinguished in Yeongdeok on the East Sea coast. The affected area was the largest among all wildfires in the Republic of Korea. This catastrophic fire also impacted parts of the protected area within Juwangsan National Park, which is important for biodiversity conservation and the provision of ecosystem services. Megafires such as this are characterized by abnormally high intensity, and they exert widespread impacts on the structure and functioning of forest ecosystems (Linley et al., 2022). Wildfires can disrupt the soil seed bank, thereby altering successional trajectories (Maia et al., 2012), and can deplete soil organic carbon, extending ecosystem recovery to timeframes that far exceed human planning horizons (Neidermeier et al., 2025). As a result, the carbon storage function of forests is impaired, which can accelerate climate change and trigger a positive feedback within disturbance regimes that transform landscapes over the long term (Bowman et al., 2009). Research on the ecological impacts of wildfires is crucial from the perspective of climate change and carbon reduction.
Moreover, wildfires are not merely ecological events but also lead to social and economic losses and can complicate the trajectory toward internationally agreed-upon carbon reduction targets (Soontha and Bhat, 2026). Megafires therefore constitute a complex challenge that extends beyond simple forest damage, influencing both the effectiveness of carbon reduction policies and the international credibility of their implementation. In the national greenhouse gas inventory reported to the United Nations Framework Convention on Climate Change (UNFCCC), forest carbon is included in the LULUCF sector, and emissions from wildfires are also accounted for (Ministry of Environment, 2024).
However, our findings provide additional context for further refining current approaches to estimating and reporting wildfire-related carbon dynamics in this sector. In the current national inventory, wildfire emissions are estimated using a single combustion efficiency factor of 0.45, taken from the 2006 Intergovernmental Panel on Climate Change (IPCC) Guidelines default for temperate forests and applied uniformly across all domestic forest types (Eggleston et al., 2006). However, because combustion efficiency can vary with tree species, stand structure, and fire intensity, the use of generalized default values may introduce uncertainty into wildfire emission estimates. Here, we propose an alternative method that links combustion efficiency to burn severity derived from RdNBR.
It is crucial to accurately assess how the fire has impaired carbon sink functions in the short term and how it has reduced longer-term carbon storage in ecosystem biomass and soils. Ideally, such precise assessments would be based on field surveys and direct biomass measurements. However, the vast spatial extent of megafires imposes severe constraints on both time and human resources. Under these conditions, the combined use of remote sensing and spatially explicit models such as InVEST provides a practical approach for generating first-order estimates of burn extent, severity, and carbon storage loss across large areas. Although these estimates cannot replace detailed field measurements, they can complement field-based investigations by identifying priority areas for validation, supporting early restoration planning, and informing provisional policy responses regarding carbon losses and emissions (Parsons et al., 2010; Pérez-Cabello et al., 2021).
As climate change is expected to increase the frequency and intensity of wildfires (IPCC, 2023), continued efforts to refine the representation of wildfire-related carbon dynamics in LULUCF accounting may support more consistent and robust national mitigation accounting (Grassi et al., 2017). The approach we propose here is intentionally simple and should be regarded as a first step that can be foundational for future studies.
A rapid assessment approach that combines remote-sensing analysis with the carbon storage module of InVEST can serve as an efficient alternative for quantifying short-term losses in carbon storage. Although its precision is lower than that of expert field-based surveys, it is useful for supporting timely decision-making and estimating losses over large spatial extents, thereby informing the development of concrete response measures (Schwantes et al., 2024). Remote-sensing techniques allow the extent of damage to be identified at an early stage and enable areas of carbon storage loss to be captured at broader spatial scales, while estimates of carbon storage reduction derived from the InVEST model, which is based on land cover maps, can provide practical support for designing region-specific restoration and management strategies. For example, during a recent megafire in California, remote sensing was effectively used to clearly delineate burned areas (Syifa et al., 2020). The InVEST model can likewise be applied to estimate carbon storage losses and can function as a valuable complement to remote sensing–based carbon assessments (Mukhopadhyay et al., 2025). Although wildfire-induced carbon storage loss is not identical to regulated compliance emissions under the Korean Emissions Trading Scheme (K-ETS), it can undermine the sink assumptions that support emissions trading and broader greenhouse-gas mitigation policies. Converting this loss into monetary terms using a K-ETS-referenced carbon price makes the values of climate-related disasters more explicit and provides supporting evidence for ecosystem restoration discussions and inventory refinement.
In this context, the present study aims to (1) develop a rapid post-fire carbon storage loss assessment framework that combines satellite-based burn-severity mapping with the InVEST carbon storage model, (2) apply it to the 2025 Uiseong megafire and (3) link the resulting storage loss to economic valuation through the K-ETS allowance price. The methodological contribution is threefold: (i) instead of the IPCC default combustion efficiency factor of 0.45 applied uniformly across Korean forests, we adopt severity-specific residual fractions that vary with burn-severity class and forest type; (ii) we employ two parallel scenarios (higher-residual aboveground; HRA and lower-residual aboveground; LRA) scenario to bracket residual uncertainty rather than reporting a single point estimate; and (iii) we present a framework that can be deployed within weeks after a megafire to inform rapid post-fire carbon-loss assessment and policy responses. The estimates presented here should be interpreted as first-order rapid assessments rather than substitutes for full combustion-based emission inventories.
This study is not intended to compute or replace the emissions and removals reported in the national greenhouse gas inventory; rather, it provides a rapid, spatially explicit estimate of wildfire-induced carbon storage loss and its economic implications as a complement to existing reporting. Throughout this study, the term carbon storage loss refers to the stock-difference (pre-fire − post-fire) in carbon pools as estimated from severity-specific residual fractions. It is conceptually distinct from direct atmospheric emissions: a portion of biomass carbon lost from the live aboveground pool may transfer to dead organic matter pools rather than being released to the atmosphere. We therefore use carbon storage loss throughout to describe what the method actually quantifies, and reserve emission for atmospheric flux estimates reported in the national greenhouse gas (GHG) inventory.
2. Methods
2.1. Study area
The study area encompasses the entire region affected by the large wildfire that ignited on 22 March 2025 in Uiseong County, Gyeongsangbuk-do, Republic of Korea. Administratively, it includes forested areas within Uiseong-gun, Andong-si, Cheongsong-gun, Yeongyang-gun and Yeongdeok-gun in Gyeongsangbuk-do (Fig. 1). The fire started in Uiseong and spread eastward under strong westerly winds, ultimately producing the largest recorded wildfire-affected area in Korea. This region forms a mountainous belt stretching from the central-eastern inland of the Korean Peninsula to the East Sea coast and has previously been reported as an area with frequent wildfire occurrence (Kim, 2014). Mean elevation ranges from approximately 200–700 m in the inland portion and gradually decreases toward the East Sea around Yeongdeok, forming a gentle east-facing slope. Spring (March–April) is known as a high-risk period for wildfire occurrence and spread, as it is characterized by relatively low precipitation, strong westerly winds, and frequent dry atmospheric conditions (Park et al., 2020). The 2025 wildfire also occurred under such conditions, with anomalously warm and dry weather combined with strong winds.
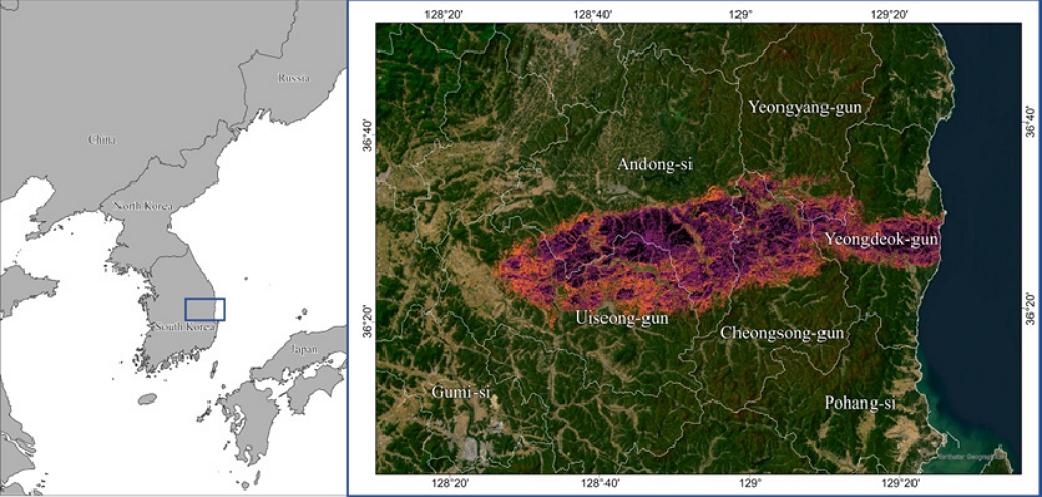
Research area showing the Uiseong wildfire in 2025 overlaid on RdNBR-derived severity
In terms of land cover, the study area represents a typical mid-continental forest landscape of central Korea, where coniferous forests, broadleaved forests, and mixed forests composed of both coniferous and broadleaved species are distributed in a mosaic pattern. In particular, Juwangsan National Park in the Cheongsong area is a temperate forest dominated by pines and oaks and has been reported to exhibit a complex vertical structure with a mixture of diverse broadleaved tree species and shrub layers, along with high plant species richness. In addition, some parts of the area overlap with legally designated protected zones, so the wildfire damage has implications that go beyond the mere loss of forest resources and is highly significant in terms of biodiversity conservation and protected area management.
2.2. Analytical methods
The overall analytical framework consists of three sequential steps: (1) burn assessment from satellite imagery, (2) InVEST based pre and post-fire carbon storage modeling, and (3) economic valuation using the K-ETS allowance price. The full workflow, including data inputs and processing steps, is summarized in Fig. 2.
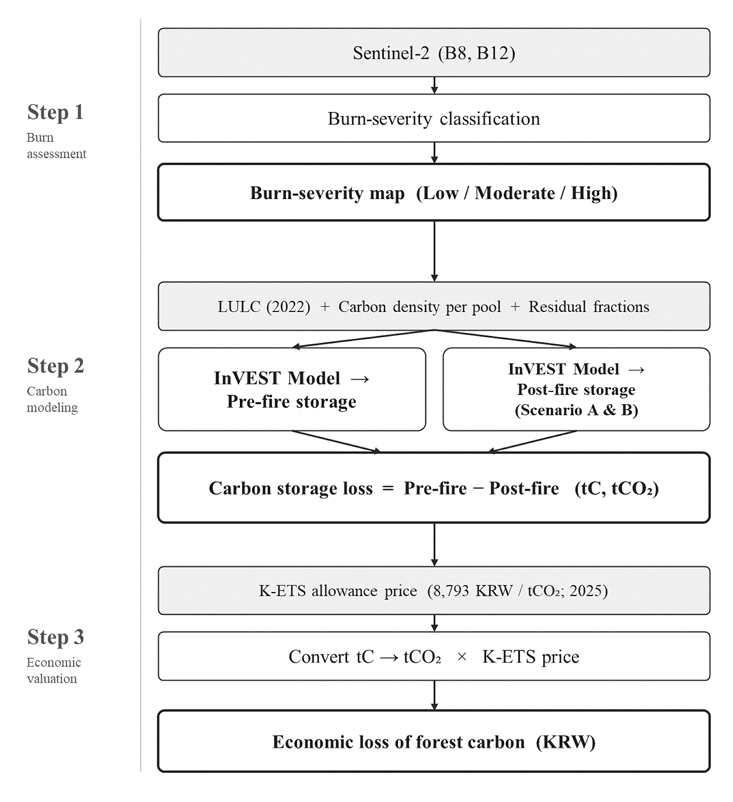
Research workflow for assessment of wildfire-induced carbon storage loss and economic value. Step 1 derives burn-severity classification from satellite imagery; Step 2 estimates pre- and post-fire carbon storage using the InVEST carbon storage model with severity-specific residual fractions (Scenarios A and B); Step 3 converts carbon loss into economic value using the K-ETS allowance price
To measure wildfire damage severity, the RdNBR was calculated from Sentinel-2 multispectral imagery using bands B8 and B12 (Fig. 2). Using Google Earth Engine, images from 14 March 2025 and 29 March 2025 were acquired, and pixels classified as clouds were excluded from the analysis. Cloud masking was conducted using the Cloud score from Google Earth Engine with a threshold of 0.65. The cloud proportion in each of two image sets was less than 10% of the entire research area, ensuring that the impact of cloud masking was not critical to our results. Cloud masked pixels were gap-filled using corresponding pixels from the nearest cloud-free acquisition date. RdNBR was computed as
| (1) |
and was adopted to enable relative comparisons among different vegetation structures. Severity thresholds were then applied to delineate three classes of burn severity. Although previous studies commonly interpret low, moderate, and high burn severity in terms of fire behavior, typically ranging from surface fires through crown fires to bole charring, we focused on a definition that is more directly usable for rapidly estimating carbon storage loss.
The low and moderate severity boundaries (0.069 and 0.315) were adopted from Miller and Thode (2007), corresponding to scaled RdNBR thresholds of 69 and 315. Because our post-fire image was acquired 15 days after ignition, that is, within the immediate post-fire assessment window, we used an elevated moderate-to-high boundary (0.9), broadly consistent with the immediate-assessment thresholds reported by Miller et al. (2009; scaled 235, 575, 835). This elevated boundary accounts for the well-documented tendency of extended-assessment thresholds to underestimate severity in immediate post-fire imagery, when vegetation spectral recovery has not yet occurred.
RdNBR values were further clamped to the range [−2, 2] prior to classification, because the square-root normalization in RdNBR is known to amplify spurious values where pre-fire NBR approaches zero (Parks et al., 2014). Less than 2% of within-perimeter pixels were affected. This classification is intended as a relative within-fire stratification for rapid carbon-loss assessment rather than a field-calibrated, absolute measure of ecological burn severity. The class-area proportions are not interpreted as ecological findings, the classes serve as spatial strata for applying severity-dependent residual-carbon fractions, and the plausible range of carbon loss is bracketed externally by Scenarios A and B.
Accordingly, regardless of forest type, grid cells with RdNBR values greater than or equal to −2 and less than 0.069 were classified as non-burned and excluded from further analysis. Grid cells with RdNBR values greater than or equal to 0.069 and less than 0.315 were classified as low-severity burns, those with values greater than or equal to 0.315 and less than 0.9 as moderate-severity burns, and those with values greater than or equal to 0.9 and less than 2 as high-severity burns (Fig. 3). All remaining analyses were conducted in R 4.5.1 using the terra package (Hijmans et al., 2026).
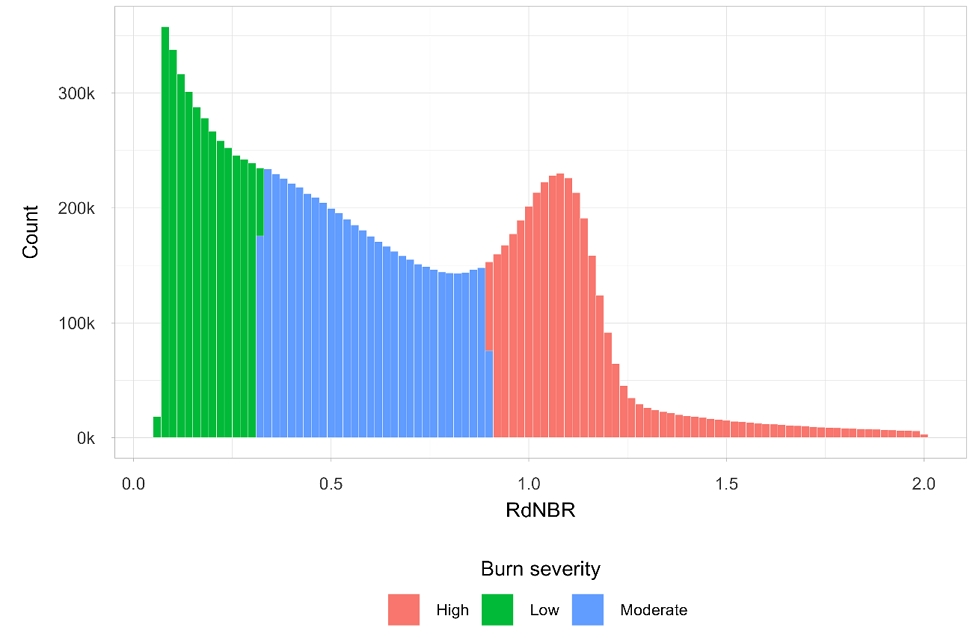
Distribution of RdNBR by burn severity classification
In this study, the InVEST carbon storage model was used to quantitatively evaluate changes in carbon storage before and after the wildfire. The InVEST carbon storage model is a spatially explicit tool that estimates the total carbon stored in a landscape at a given time by combining a land-use land cover (LULC) map with carbon density values for four carbon pools: aboveground biomass (AGB), belowground biomass, soil, and dead organic matter (Nelson et al., 2009). Here, AGB refers to all living biomass above the soil surface, including stems, branches, bark, and foliage, while belowground biomass includes live root biomass. Soil organic carbon represents the stock of organic matter stored in soils and is known to constitute the largest carbon pool in terrestrial ecosystems. The dead organic matter pool encompasses not only litter but also both downed and standing dead wood. To estimate post-fire carbon storage, a post-fire LULC map was first constructed that incorporated the mapped burn-severity classes. Carbon storage was then recalculated by subdividing the original forest types (broadleaved, coniferous, and mixed forests) into three fire-severity levels according to the burn-severity classification and assigning corresponding carbon densities to each class.
In this study, the Level-2 Land Cover Map of Korea produced in 2022 by the Ministry of Climate, Energy and Environment was used as the LULC input. The Korean Level-2 Land Cover Map is the standard national land cover product, generated through visual interpretation of high-resolution satellite imagery at approximately 5 m spatial resolution, and hierarchically classifies the land surface into 23 mid-level categories grouped under seven major classes (urban and built-up areas, agricultural land, forest, grassland, wetland, bare land, and water bodies). For this study, the three forest categories defined the spatial domain of the InVEST carbon storage analysis, while non-forest categories were retained as background but were not subjected to severity-specific residual fraction calculations. In constructing the post-fire LULC layer, each forest pixel within the burn perimeter was further subdivided by overlaying the RdNBR-derived burn-severity map, yielding nine post-fire forest classes (3 forest types by 3 severity levels) to which the corresponding carbon densities and residual fractions were applied.
Baseline carbon density values for the four carbon pools by forest type were referred from previous research (Ministry of Environment and National Institute of Ecology, 2022). Post-fire carbon densities were estimated by applying pool-specific residual fractions to these pre-fire values. Since there is uncertainty in post-fire aboveground carbon residuals, we defined two scenarios, A - higher-residual aboveground and B - lower-residual aboveground, that reflect alternative assumptions about the residual fraction. The residual fractions of each carbon pool by forest type (Table 1) were determined by synthesizing analyses presented in the Monitoring of Ecological Damage and Risk in the Jirisan Hadong Wildfire Area report (Korea National Park Service National Park Research Institute, 2024) and in previous studies (De Santis et al., 2010; Sweeney et al., 2023).

Residual fractions of carbon pools (%) by forest type and burn severity
For the aboveground pool (scenario A), severity-specific residual fractions were derived from the adjusted burning efficiency (BEadj) values reported by De Santis et al., who grouped burn severity into three biomass-consumption classes rather than vegetation mortality classes. In that study, BEadj for coniferous vegetation was 0.25, 0.47, and 0.65 under low-, moderate-, and high-severity fire, respectively, while the corresponding values for broadleaved vegetation were 0.25, 0.40, and 0.56. Accordingly, residual fractions (1 − BEadj) were set to 0.75, 0.53, and 0.35 for coniferous forests and 0.75, 0.60, and 0.44 for broadleaved forests. For mixed forests, where species-composition data were unavailable, proxy residual fractions were estimated as the simple mean of the coniferous and broadleaved values, yielding 0.75, 0.565, and 0.395 for low, moderate and high severity fire, respectively.
In contrast, the aboveground scenario B is a field-based residual fraction derived from the wildfire damage survey conducted as part of the ecosystem damage and risk monitoring of the Jirisan Hadong fire by the Korea National Park Research Institute (Korea National Park Service National Park Research Institute, 2024). Using the proportion of surviving trees and the degree of crown damage by forest type and burn severity, the actual proportion of stem and crown biomass remaining immediately after the fire was estimated. Based on these estimates, the aboveground residual fractions for low, moderate, and high severity areas were set to 58%, 15%, and 0%, respectively.
Relative to the scenario A, the scenario B intended to avoid overestimating the amount of remaining aboveground biomass. It should be interpreted as a conservative lower-bound estimate of the remaining live aboveground carbon storage immediately after fire, rather than as a direct measure of total standing biomass left on site. In severely burned stands, stems or branches may remain physically present after the fire, but much of this material no longer functions as living aboveground biomass and is more appropriately regarded as transferred to dead organic matter pools. From this perspective, the 0% residual assigned to high-severity areas in scenario B does not imply the complete disappearance of all aboveground material, but rather the near-total loss of live aboveground carbon storage immediately after burning. Because this scenario is grounded in post-fire field observations from Korean forests, it may better reflect local damage patterns than values derived solely from studies conducted in other regions. At the same time, because the same residual fractions were applied across forest types within each severity class, scenario B remains a simplified approximation intended for rapid post-fire assessment rather than a fully mechanistic representation of biomass consumption and transfer processes.
In contrast to aboveground biomass, belowground biomass, soil organic carbon, and dead wood-litter were not assigned scenario-specific residual fractions. Reported values for these three pools converge within a relatively narrow range across the literature, and their combustion variability during a single fire event is much smaller than that of aboveground biomass; we therefore applied single best-estimate values following Sweeney et al. (2023). Belowground carbon was assumed to remain at 100% across all burn-severity classes, as sub-surface biomass is largely protected from direct heating and is unlikely to be substantially combusted in the short term. Soil organic carbon was retained at 99% in low- and moderate-severity areas and 95% in high-severity areas, consistent with the limited combustion typically observed in the upper soil layer during fast-moving fires (Maia et al., 2012; Sweeney et al., 2023). Because dead wood and the litter layer are more directly exposed to combustion and heating, their residual fractions were set to 79%, 76%, and 65% for low, moderate and high severity classes, respectively. Concentrating the A, B contrast on aboveground biomass therefore directs scenario-based uncertainty analysis to the pool where it is most needed.
Accordingly, the aboveground scenario A represents a higher-residual case, synthesized from previous studies from various ecosystems, whereas the aboveground scenario B represents a lower-residual case based on post-fire field observations reported by the Korea National Park Research Institute. The remaining pools such as belowground, soil, and dead wood-litter which incorporate pool-specific residual fractions were derived from Sweeney et al. (2023). These carbon pool residual fractions were applied to the InVEST carbon storage model and compared to the total carbon storage before and immediately after the wildfire, thereby quantifying carbon losses by burn severity and forest type.
To evaluate the plausibility of the pre-fire aboveground carbon estimates produced by the InVEST carbon storage model, we conducted an external consistency assessment using the European Space Agency Climate Change Initiative Biomass product (ESA CCI Biomass). The ESA CCI Biomass product provides spatially explicit global maps of AGB at 100 m spatial resolution, along with uncertainty information for selected years. Because the ESA CCI product represents aboveground biomass only, the comparison was restricted to the aboveground carbon pool of the InVEST output. Belowground biomass, soil organic carbon, and dead organic matter pools were excluded from this comparison to ensure consistency between the two datasets.
The most recent ESA CCI AGB layer available before the wildfire was used as an independent reference dataset for pre-fire aboveground biomass conditions. ESA CCI AGB values, originally expressed as biomass density, were converted to aboveground carbon density by applying a carbon fraction of 0.47. The converted ESA CCI aboveground carbon density was then compared with the pre-fire aboveground carbon density estimated from the InVEST model.
Before comparison, both datasets were projected to the same coordinate reference system and clipped to the burned forest area used in the main analysis. To avoid artificially increasing the number of comparison pixels by downscaling the coarser ESA CCI product, the InVEST aboveground carbon map was aggregated to the 100 m resolution of the ESA CCI Biomass product using the mean value of all valid forest pixels within each ESA CCI grid cell. Grid cells with missing values, non-forest land cover, or insufficient valid forest pixels were excluded from the analysis.
2.3. Estimation of the economic value of carbon storage loss
Environmental values can be expressed in monetary terms using four broad classes of valuation methods: direct market price methods, indirect market price methods, non-market valuation methods, and value transfer approaches (Koetse et al., 2015; Selivanov and Hlaváčková, 2021). Among these, we adopted a direct market price method, applying the allowance prices observed in the K-ETS. The K-ETS regulates greenhouse gases in units of tCO2-eq rather than CO2 alone. In the present study, however, the K-ETS price was applied not to estimate actual compliance emissions, but as a market-referenced benchmark for valuing wildfire-induced forest carbon storage loss. Accordingly, this study is designed as a carbon storage loss valuation rather than a full wildfire greenhouse gas emission inventory. This choice allows rapid estimation in the aftermath of a disaster without additional surveys or model assumptions, and directly reflects institutional carbon prices, thereby providing a loss estimate that is closely linked to actual policy and market conditions. Lost aboveground carbon storage (tC) was converted into CO2 units (tCO2) using the molecular weight ratio of 44/12 (Pearson et al., 2013), allowing the result to be expressed in a market-comparable unit. The converted tCO2 value was then multiplied by the average K-ETS allowance price over approximately one month following the wildfire outbreak on 22 March 2025. On this basis, the economic value used in this study was 8,793 KRW per metric ton of CO2.
3. Results
3.1. Forest types and burn severity
Of the total burned area, approximately 62% was forest, which was analyzed by forest type and burn severity. Based on the RdNBR thresholds, burn severity was classified into three levels and combined with forest type to yield nine categories in total (Table 2). The total forest area affected by the wildfire was 105,624 ha. Of this, coniferous forests accounted for 56,256 ha (53.3% of the burned forest area), while broadleaved and mixed forests covered 34,576 ha (32.7%) and 14,792 ha (14.0%), respectively. By burn severity, low, moderate, and high classes occupied 27,493 ha (26.0%), 44,977 ha (42.6%), and 33,154 ha (31.4%), respectively, with the three classes being relatively evenly distributed, although the moderate class was the most prevalent, as shown in Table 2.
Burned forest area by forest type and burn severity
The distribution of burn severity and area differed among forest types. Coniferous forests not only occupied the largest area but also showed pronounced moderate and high severity. The low-severity area in coniferous forest was 15,299 ha, corresponding to 27.2% of the burned coniferous forest, while moderate severity covered 20,733 ha (36.9%) and high severity 20,224 ha (36.0%), indicating similar shares for the moderate and high classes. In broadleaved forests, the low-severity area was only 7,719 ha (22.3%), whereas moderate severity covered 17,106 ha (49.5%) and high severity 9,751 ha (28.2%), suggesting that roughly half of the burned broadleaved forest experienced moderate-severity fire. Mixed forests occupied the smallest share of the burned forest overall. However, their burn-severity distribution was similar to, or slightly more moderate than, that of broadleaved forests. In mixed forests, the low-severity area was 4,475 ha (30.2%), moderate severity 7,139 ha (48.3%), and high severity 3,179 ha (21.5%), with about half of the area in the moderate class and a relatively lower proportion of high severity compared with coniferous forests.
Taken together, the distribution of burned areas by forest type and severity indicates that the wildfire produced particularly concentrated moderate- and high-severity damage in coniferous forests, whereas broadleaved and mixed forests were characterized by a predominance of moderate-severity burns, as shown in Fig. 4.
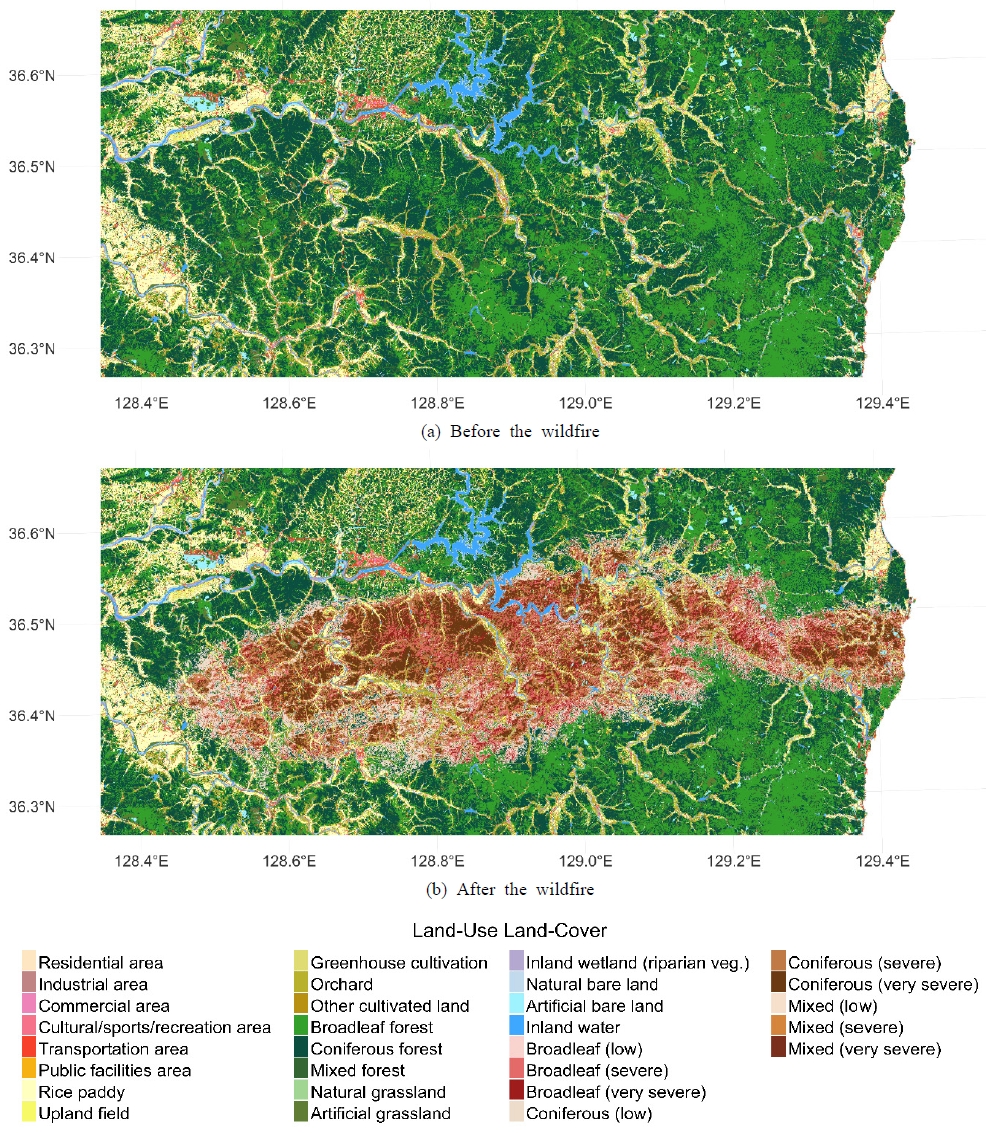
Land cover maps before and after the wildfire
3.2. Carbon storage loss
Before the wildfire, the total aboveground carbon storage in the study area was estimated at 18.59 MtC, corresponding to an average of approximately 176 tC ha-1 over the burned area (105,624 ha; Fig. 5). After the fire, it decreased to about 14.7–12.9 MtC, depending on the assumed aboveground residual scenario, and the mean density declined to roughly 140–123 tC ha-1. Thus, aboveground carbon storage losses attributable to the wildfire were 3.85–5.66 MtC, equivalent to approximately 21–30% of the pre-fire aboveground stock, as shown in Fig. 6 (a). On a per-area basis, this corresponds to an average loss of 36.5–53.6 tC ha-1, or about 134–196 tCO2 ha-1 when expressed in CO2-equivalent terms.
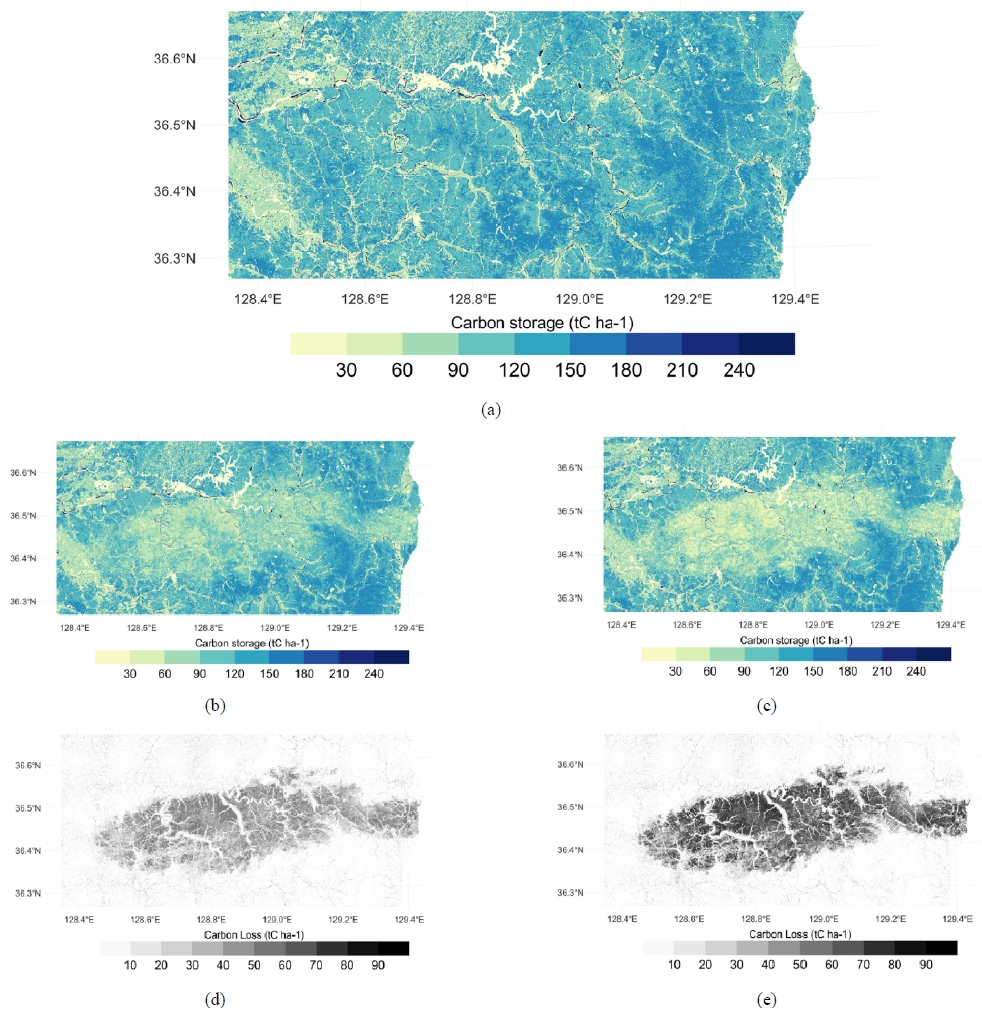
Spatial distribution of carbon storage before and after the wildfire and associated carbon storage loss (a) pre-fire carbon storage, (b) post-fire carbon storage, scenario A, (c) post-fire carbon storage, scenario B, (d) carbon storage loss, scenario A and (e) carbon storage loss, scenario B
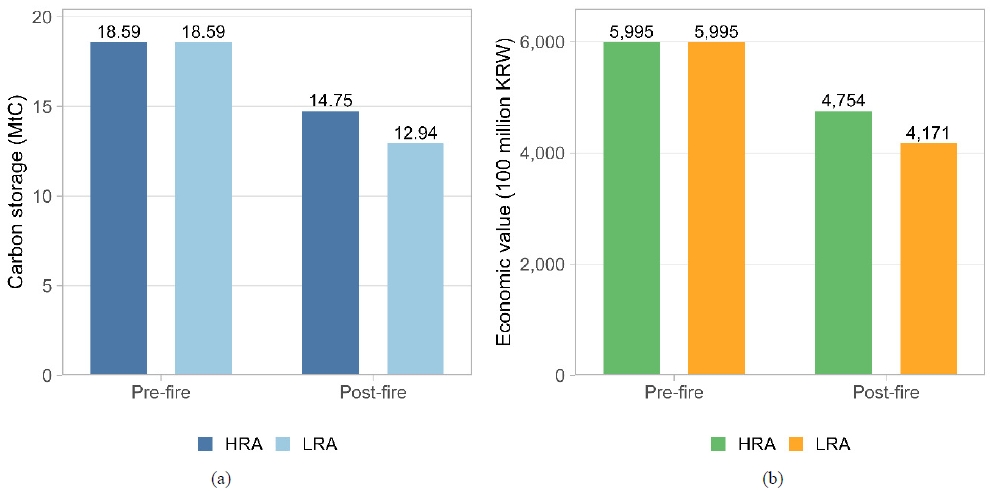
Bar chart showing changes in carbon storage before and after the wildfire (a). Changes in the estimated economic value of carbon storage (b)
3.3. Economic valuation of carbon storage loss
Based on the aboveground carbon storage loss (3.85–5.66 MtC) estimated from pre- and post-fire stocks, pre-fire economic value of aboveground carbon storage in the study area was estimated at approximately 599.5 billion KRW, while the post-fire value decreased to about 475.4–417.1 billion KRW, depending on the assumed residual scenario in Fig. 6 (b). The difference between these two estimates represents the loss of carbon storage capacity and corresponds to roughly 14.1–20.7 MtCO2 when expressed in CO2-equivalent units. This loss is equivalent to an economic value of approximately 124.0–182.4 billion Korean won at the applied ETS price. The burned forest area (105,624 ha) lost roughly 1.2-1.8 million KRW of carbon value per hectare. Aboveground carbon storage declined by 21–30% relative to pre-fire storage, showing that a single megafire can eliminate a large portion of forest carbon within a short period.
3.4. External consistency of carbon storage estimates
The InVEST-derived pre-fire aboveground carbon estimates were compared with ESA CCI Biomass-derived aboveground carbon estimates aggregated to the same 100 m grid. Across the burned forest area, the spatial distribution of InVEST-derived aboveground carbon was broadly consistent with the ESA CCI-based estimates, although systematic differences were observed among forest types. The pixel-wise difference, defined as ESA CCI-derived carbon minus InVEST-derived carbon, was generally negative, indicating that the InVEST model tended to estimate higher aboveground carbon density than ESA CCI Biomass.
Most differences ranged from approximately 25 tC ha-1 in broadleaved and coniferous forests to −50 tC ha-1 in mixed forests, suggesting that the magnitude of discrepancy varied by forest type. This pattern may reflect differences in the input data and modeling assumptions of the two approaches. The InVEST estimates were based on land cover-specific carbon density coefficients, whereas ESA CCI Biomass represents a satellite-derived biomass estimate at coarser spatial resolution. In addition, forest-type classification errors, stand-age heterogeneity, mixed pixels, and the temporal mismatch between the land cover map and ESA CCI Biomass layer may have contributed to the observed differences.
The comparison therefore indicates that the InVEST-derived carbon estimates are within a broadly plausible range but also highlights uncertainty in absolute carbon density estimates, particularly for mixed forests. Because the ESA CCI Biomass product is not a field-measured reference dataset, these results should be interpreted as an external consistency assessment rather than a full validation of carbon stock accuracy.
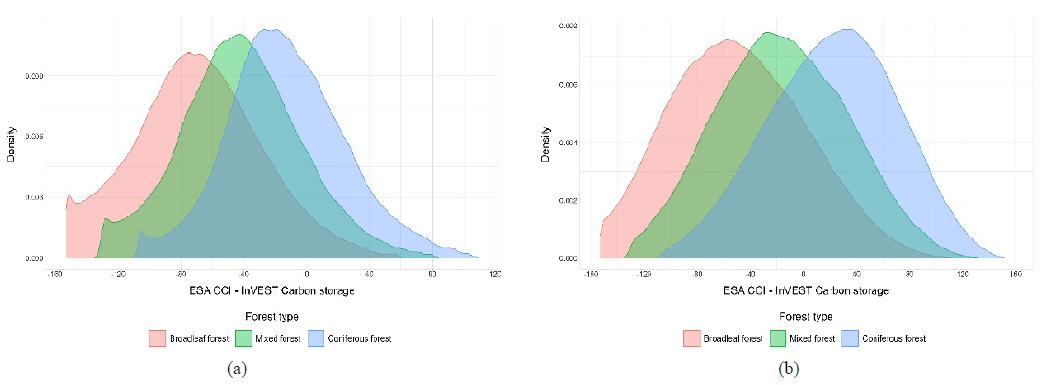
Differences between ESA CCI AGB-based estimates and carbon storage estimates from the InVEST carbon storage model
4. Discussion
4.1. Summary of key findings
The 2025 wildfire that started in Uiseong, Gyeongsangbuk-do was the largest recorded wildfire in the Republic of Korea, and our analysis suggests that carbon storage in the burned forests was reduced by up to about 100 tC ha-1 in the most severely affected areas. Given that many of the burned stands stored roughly 100–200 tC ha-1 of aboveground carbon prior to the fire, this implies that a substantial portion of the local carbon storage capacity was lost. Total aboveground carbon storage loss in the study area was estimated at 3.85–5.66 MtC, equivalent to 14.1–20.7 MtCO2, representing 21–30% of the pre-fire stock. Applying the 2025 average price in the Korean ETS yields an estimated economic loss of about 124.0–182.4 billion KRW. This is comparable to the annual emissions of approximately 3.2–4.7 million passenger vehicles, highlighting the large impact that a single wildfire can have on regional carbon budgets and the national carbon economy.
About 47% spread between Scenario A (3.85 MtC) and Scenario B (5.66 MtC) directly reflects how much aboveground biomass is assumed to remain in the most severely burned stands. Scenario A draws its residual fractions from the burning-efficiency dataset of De Santis et al. (2010), which synthesizes fire-effects observations across multiple ecosystems and assigns non-zero residuals (35–44%) even under high-severity classes. Scenario B is anchored to post-fire field surveys conducted by the Korea National Park Service National Park Research Institute (2024) after the 2022 Jirisan–Hadong wildfire, which report near-zero live aboveground biomass in high-severity stands. The difference between the two estimates is therefore not a measurement uncertainty but a structural uncertainty in how the residual layer is modeled. Practically, Scenario A can be interpreted as an upper-bound of remaining live aboveground biomass, while Scenario B represents a lower bound that more directly reflects Korean forest conditions but assumes the most severe local damage pattern applies basin-wide. Reporting both scenarios is therefore preferable to citing a single point estimate, because the downstream interpretation of the wildfire’s carbon impact depends sensitively on which residual structure is adopted. This finding also motivates future work to develop nationally calibrated residual fractions across multiple Korean wildfire events, which would narrow this structural uncertainty.
Globally, forests store an estimated 662 GtC as of 2020, with roughly half of this stock contained in aboveground biomass and soil carbon pools (FAO, 2020). Over recent decades, forest biomass carbon in northern ecosystems has generally increased. However, since around 2016 it has shifted from a positive to negative trend, largely associated with widespread drought, wildfires and other disturbances (Li et al., 2025). Our finding that a single wildfire in Uiseong removed a sizable portion of the carbon storage accumulated over several decades suggests that the stability of forest carbon storage is far more uncertain than previously assumed. With the disturbance of soil seed banks, losses of soil organic carbon, and delayed emissions from dead wood, wildfires represent more than a short-term carbon release. They also consume future carbon sequestration that would have accumulated over the coming decades.
4.2. Implication of the Uiseong wildfire within the national GHG inventory and carbon neutrality strategy
Before discussing the broader implications, we emphasize that this analysis is a rapid first-order assessment based on satellite-derived burn severity and a stock-difference framework, rather than a full combustion-based emission inventory; the linkages outlined below are intended to inform discussion of inventory and accounting improvements rather than to prescribe compliance-level revisions. The unexpected depletion of carbon storage also has important implications for the national GHG inventory and carbon neutrality strategy. As a Party to the UNFCCC and the Paris Agreement, the Republic of Korea is required to submit an annual national GHG inventory, and its net emissions, including the land use and forest sector, were reported to be approximately 686.5 MtCO2 eq in 2022 (Ministry of Environment, 2022).
The loss of carbon storage capacity associated with the Uiseong wildfire was estimated at about 14.1–20.7 MtCO2 which corresponds to roughly 37–55% of the annual net removals in 2022 and reported for the LULUCF sector. This suggests that a single megafire can substantially affect the annual carbon sequestration of forest sinks recorded in the national inventory. Under climate conditions where the frequency and magnitude of wildfires are increasing, such events may become a major driver of year-to-year variability in the inventory.
The IPCC Guidelines in 2006 and the LULUCF Good Practice Guidance adopt the managed land proxy whereby emissions and removals in the land sector are reported as total fluxes from managed lands (Eggleston et al., 2006). This approach represents a pragmatic compromise, recognizing the practical difficulty of disentangling anthropogenic and natural fluxes in the land sector. However, some countries, including Canada and Brazil, have introduced supplementary approaches that explicitly distinguish natural disturbances such as wildfires in their reporting. Korea is likewise discussing institutional improvements to refine its LULUCF statistics, and there is a need for further debate on how to incorporate emissions from disturbance events like wildfires, as well as their long-term recovery trajectories, into the national inventory. Our results offer a foundation for separate disturbance accounting and for interpreting national inventory outcomes in years affected by major wildfires.
4.3. Linkages with the Paris Agreement, the Framework Act on Carbon Neutrality and Green Growth, and the K-ETS
The economic loss of 124–182 billion KRW estimated here acquires policy meaning only when placed within Korea’s carbon-policy framework. This framework is shaped, at a higher level, by the Paris Agreement, whose Article 5 explicitly calls for conserving and enhancing forest sinks, and by Korea's Framework Act on Carbon Neutrality and Green Growth, which codifies the 2050 carbon neutrality vision and identifies the conservation and expansion of forest sinks as a key policy instrument. Korea has also operated the K-ETS since 2015 as a core mitigation instrument covering major emitters across the power, industry, building, and transport sectors. Unlike a carbon-only accounting framework, the K-ETS covers multiple greenhouse gases expressed in units of tCO2-eq. Thus, the allowance price reflects the market value of one metric ton of CO2-equivalent emissions rather than CO2 alone. In this study, the K-ETS price is applied only as a market benchmark for valuing wildfire-induced carbon storage loss, whereas non-CO2 wildfire combustion emissions such as CH24 and N2O are not included in the main accounting framework. As of 2024, the average auction price in the K-ETS is reported to be about 10,355 KRW tCO2-1, and the average secondary-market price to be about 9,238 KRW tCO2-1, with cumulative auction revenues reaching roughly 1.4 trillion KRW. In this study, we applied a comparable market price of 8,793 KRW tCO2-1 to estimate the value of the carbon storage loss caused by the Uiseong wildfire at approximately 124.0–182.4 billion KRW. This implies that a single wildfire effectively destroys a volume of carbon assets whose value is equivalent to a substantial portion of the fiscal resources accumulated over several years through the ETS, thereby eroding the practical room for maneuver afforded by carbon-neutral policy instruments.
Therefore, the Uiseong wildfire suggests that the assumed stability of forest sinks, which underpins the implementation of Korea’s NDC under the Paris Agreement, the Framework Act on Carbon Neutrality and Green Growth, and domestic mitigation policies centered on the K-ETS, may benefit from periodic review and the inclusion of more conservative scenarios that account for wildfire disturbance. As disturbances such as wildfires, drought and pest outbreaks become more frequent, it may be unrealistic to assume that forest sinks will remain stable over time. More conservative sink scenarios that explicitly account for wildfire risk are therefore needed.
4.4. Contributions of remote sensing-InVEST model-based wildfire carbon assessment to inventories and policy
Our results demonstrate that combining satellite-derived burn severity with the InVEST model can quantify wildfire-induced carbon storage loss within weeks of a megafire. This capability addresses the growing need for assessment tools that can more precisely quantify wildfire-induced carbon losses, as wildfire risk increases and uncertainty surrounding forest carbon sinks grows. Nevertheless, in practical national inventory work, it remains difficult to incorporate wildfire damage at high spatial resolution due to limitations in data availability, value, and time. In Korea as well, forest carbon storage is estimated using sources such as the National Forest Inventory and basic forest statistics. However, a systematic method for capturing carbon losses by burn severity in the immediate aftermath of large wildfires has yet to be established.
This study evaluated carbon storage loss by delineating the extent and severity of fire damage using the satellite-based RdNBR index and then applying severity-specific residual fractions to the pre-fire carbon storage map produced by the InVEST carbon storage model. This approach enables the estimation of post-fire reductions in carbon storage within a relatively short period after a wildfire, and the resulting estimates can serve as a useful baseline for national inventory agencies or local governments when applying temporary correction factors after large fires or when establishing separate accounts for natural disturbances.
4.5. Limitations and future research directions
Given that this study was designed to propose a rapid, simplified assessment method, it entails several important limitations. First, the accuracy of the carbon storage estimates derived from the InVEST model and remote sensing are limited. Although the analysis included a broad set of carbon pools, the residual fractions for these pools were taken from representative values reported in previous studies and applied uniformly across forest types. In contrast, for aboveground biomass, we distinguished between (A) a baseline residual assumption derived from previous live burning efficiency studies and (B) a more conservative residual assumption that assumes greater combustion in high-severity classes based on field surveys by the Korea National Park Research Institute. We then applied these differentially by burn severity. Consequently, the residual fractions for belowground biomass, soil carbon, and dead organic matter reflect broad averages rather than conditions specific to Korean forests or differences across severity classes. Developing more detailed and locally calibrated biophysical tables will therefore be essential for improving the accuracy of these pool estimates.
Furthermore, transitions between carbon pools were not explicitly simulated. Wildfire-induced tree mortality results in both immediate emissions and transfers of carbon from live biomass into dead organic matter pools such as standing dead wood and litter. A simple stock-difference approach, however, cannot distinguish between these processes and may implicitly treat all reductions in biomass as atmospheric emissions. In this study, severity-specific residual fractions were applied to estimate post-fire changes in dead organic matter and soil pools. However, we did not separate carbon transferred into these pools from carbon lost through combustion or decomposition. Moreover, the distinction between residual scenarios (A and B) was applied only to aboveground biomass. Belowground, soil, and dead organic matter pools shared the same residual values in both scenarios. As a result, the comparison between scenarios does not fully capture uncertainties in other carbon pools or the transition processes among them.
Second, the severity-specific residual fractions do not adequately capture the structural heterogeneity of Korean forests, including differences in species composition, stand age, diameter class, and stand density. For developing a rapid, nationally applicable assessment method, we assumed a uniform stand structure and varied the residual fractions only by burn severity. As a result, variation in combustion patterns among forest types within the same severity class, for example, between young plantations, mature coniferous stands, or old broadleaved stands, was not represented, causing potential for over- or underestimating carbon losses, particularly in old coniferous forests or very dense stands.
Future research should therefore (1) refine residual fractions by forest type and stand age through integration with existing forest survey data, such as the National Forest Inventory and surveys in national parks, (2) develop nation-wide carbon storage models for soil and dead biomass pools that incorporate domestic observational and experimental data and (3) conduct long-term carbon budget analyses that account for wildfire occurrence probabilities under climate scenarios and repeated-burn scenarios. As such work accumulates, evaluating how large wildfires affect Korea’s carbon-neutral pathway and national GHG inventory will be more precise, and policies can be designed under the Framework Act on Carbon Neutrality and Green Growth and the K-ETS that systematically incorporate wildfire risk.
At the same time, this study has clear limitations in that its estimates of carbon storage loss are based on residual-rate cases derived from a limited region and on a short-term assessment of a single wildfire event. In addition, the present framework focuses on post-fire carbon storage loss rather than a full combustion-based wildfire emission inventory. Therefore, non-CO2 wildfire emissions such as CH4 and N2O were not included in the main valuation, and the reported monetary values should be interpreted as a partial valuation of forest carbon storage loss. Future research should refine locally specific residual fractions that reflect species composition and stand age structure, develop integrated carbon storage models that include both soil and biomass pools, and carry out long-term carbon budget analyses that incorporate climate scenarios and the possibility of recurring wildfires.
5. Conclusions
This study quantified changes in aboveground carbon storage before and after the 2025 megafire in Uiseong, Gyeongsangbuk-do, using a combined approach based on remote sensing and the InVEST carbon storage model. We first spatially estimated pre-fire aboveground carbon storage with the InVEST carbon storage model and then applied RdNBR-based burn-severity maps and severity-specific residual fractions. Our result quantitatively demonstrates that a single wildfire event can substantially weaken carbon storage functions that have accumulated over several decades within a very short period.
When the lost carbon storage capacity was converted using the domestic emissions trading price, the carbon asset loss associated with the Uiseong wildfire was estimated at roughly 124 billion KRW. This shows that a momentary large-scale wildfire can effectively eliminate a portion of the emission allowances and sink capacity that the country has built up over a long period in pursuit of carbon neutrality. At the same time, because this loss is linked not only to forest damage, infrastructure destruction, and impacts on local communities, but also to the erosion of carbon storage capacity, it should be recognized as a major component of national-scale loss. By combining the InVEST model with remote sensing techniques, this study also provides a basis for identifying areas of severe damage and offers concrete economic evidence for valuing losses and planning investments in post-fire restoration.
Methodologically, this study proposed a streamlined post-fire assessment procedure that combines remote sensing–derived burn severity with the InVEST carbon storage model to enable rapid appraisal immediately after a large wildfire. Because this approach represents wildfire-induced carbon storage loss in a spatially explicit form, it can serve as a complementary tool to add spatially explicit context to national GHG inventories and forest-carbon statistics, without replacing their combustion-based accounting. As global warming increases the frequency of extreme weather events and the likelihood of large wildfires, rapid assessment frameworks of this kind can provide essential baseline information for interpreting wildfire impacts on LULUCF removals. They can also support discussions on how natural disturbances should be incorporated into the inventory framework.
From a policy perspective, our findings indicate that the stability of forest carbon sinks, implicitly assumed in Korea’s NDC under the Paris Agreement and in the Framework Act on Carbon Neutrality and Green Growth for Coping with the Climate Crisis, can no longer be taken for granted under the combined pressures of the climate crisis and megafires. In a context where forest disturbances such as wildfires, drought, and pest outbreaks are becoming more frequent, designing mitigation pathways that assume invariant forest sinks may be overly optimistic. Future NDC updates and long-term low-carbon strategies will need more risk-informed sink scenarios that incorporate wildfire occurrence probabilities and post-fire recovery rates. In addition, the high-loss areas identified in this study can be used to set priorities for restoration by considering their overlap with protected areas and ecological corridors.
By presenting changes in carbon storage and the associated economic losses before and after the fire in concrete numerical terms and within a policy context, this study provides an empirical starting point for linking wildfire, carbon, and policy. It represents an attempt to offer a practical answer to the question of “where, how much, and by what methods should carbon storage loss be assessed immediately after a large wildfire?” and can serve as a basis for designing national carbon policies and forest, protected area management strategies that explicitly take wildfire risk into account.
Acknowledgments
This work was supported by the project “Development of LiDAR-based Greenhouse Gas Assessment Technology for Terrestrial Ecosystems in National Parks” (2026).
References
-
Bowman DMJS, Balch JK, Artaxo P, Bond WJ, Carlson JM, Cochrane MA, D’Antonio CM, DeFries RS, Doyle JC, Harrison SP, Johnston FH, Keeley JE, Krawchuk MA, Kull CA, Marston JB, Moritz MA, Prentice IC, Roos CI, Scott AC, Swetnam TW, van der Werf GR, Pyne SJ. 2009. Fire in the earth system. Science. 324: 481-484.
[https://doi.org/10.1126/science.1163886]

-
De Santis A, Asner GP, Vaughan PJ, Knapp DE. 2010. Mapping burn severity and burning efficiency in California using simulation models and Landsat imagery. Remote Sens Environ 114: 1535-1545.
[https://doi.org/10.1016/j.rse.2010.02.008]
- Eggleston HS, Buendia L, Miwa K, Ngara T, Tanabe K (eds). 2006. 2006 IPCC guidelines for national greenhouse gas inventories. Hayama, Japan: IGES.
- Esri. 2025. World imagery [basemap]; [accessed 2025 Nov 26]. https://services.arcgisonline.com/ArcGIS/rest/services/World_Imagery/MapServer
- FAO. 2020. Global forest resources assessment.
-
Grassi G, House J, Dentener F, Federici S, den Elzen M, Penman J. 2017. The key role of forests in meeting climate targets requires science for credible mitigation. Nat Clim Change 7: 220-226.
[https://doi.org/10.1038/nclimate3227]
- Hijmans R, Brown A, Barbosa M. 2026. Terra: Spatial data analysis. R package version 1.9-29; [accessed 2025 May 15]. https://rspatial.org/
-
IPCC. 2023. Climate change 2023: Synthesis report. Contribution of working groups I, II and III to the sixth assessment report of the Intergovernmental Panel on Climate Change [Core writing team, Lee H, Romero J (eds)]. Geneva, Switzerland: IPCC.
[https://doi.org/10.59327/IPCC/AR6-9789291691647]
- Kim DY. 2014. Spatial analysis of forest fire occurrence using GIS (in Korean). Geogr J Korea 48(3): 325-336.
- Koetse MJ, Brouwer R, Van Beukering PJH. 2015. Economic valuation methods for ecosystem services. In: Bouma JA, Van Beukering PJH (eds). Ecosystem services, 1st edn. Cambridge University Press. p. 108-131.
-
Korea National Park Service National Park Research Institute. 2024. Monitoring of ecological damage and risk in the Jirisan Hadong Wildfire Area report. Korea National Park Service National Park Research Institute.
[https://doi.org/10.1017/CBO9781107477612.009]
-
Li X, Ciais P, Fensholt R, Chave J, Sitch S, Canadell JG, Brandt M, Fan L, Xiao X, Tao S, Wang H, Albergel C, Yang H, Frappart F, Wang M, Bastos A, Maisongrande P, Qin Y, Xing Z, Cui T, Yu L, He L, Zheng Y, Liu X, Liu Y, De Truchis A, Wigneron JP. 2025. Large live biomass carbon losses from droughts in the northern temperate ecosystems during 2016-2022. Nat Commun 16: 4980.
[https://doi.org/10.1038/s41467-025-59999-2]
-
Linley GD, Jolly CJ, Doherty TS, Geary WL, Armenteras D, Belcher CM, Bliege Bird R, Duane A, Fletcher MS, Giorgis MA, Haslem A, Jones GM, Kelly LT, Lee CKF, Nolan RH, Parr CL, Pausas JG, Price JN, Regos A, Ritchie EG, Ruffault J, Williamson GJ, Wu Q, Nimmo DG. 2022. What do you mean, ‘megafire’? Glob Ecol Biogeogr 31: 1906-1922.
[https://doi.org/10.1111/geb.13499]
-
Maia P, Pausas JG, Arcenegui V, Guerrero C, Pérez-Bejarano A, Mataix-Solera J, Varela MET, Fernandes I, Pedrosa ET, Keizer JJ. 2012. Wildfire effects on the soil seed bank of a maritime pine stand — The importance of fire severity. Geoderma 191: 80-88.
[https://doi.org/10.1016/j.geoderma.2012.02.001]
-
Miller JD, Knapp EE, Key CH, Skinner CN, Isbell CJ, Creasy RM, Sherlock JW. 2009. Calibration and validation of the relative differenced Normalized Burn Ratio (RdNBR) to three measures of fire severity in the Sierra Nevada and Klamath Mountains, California, USA. Remote Sens Environ 113: 645-656.
[https://doi.org/10.1016/j.rse.2008.11.009]
-
Miller JD, Thode AE. 2007. Quantifying burn severity in a heterogeneous landscape with a relative version of the delta Normalized Burn Ratio (dNBR). Remote Sens Environ 109: 66-80.
[https://doi.org/10.1016/j.rse.2006.12.006]
-
Ministry of Environment. 2022. 2022 national greenhouse gas inventory report of Korea.
[https://doi.org/10.1016/j.rse.2006.12.006]
- Ministry of Environment. 2024. 2024 national greenhouse gas inventory report of Korea.
- Ministry of Environment, National Institute of Ecology. 2022. Establishment of ecosystem service evaluation and utilization measures. Seocheon-gun, Korea
-
Mukhopadhyay A, Hati JP, Acharyya R, Pal I, Tuladhar N, Habel M. 2025. Global trends in using the InVEST model suite and related research: A systematic review. Ecohydrol Hydrobiol 25: 389-405.
[https://doi.org/10.1016/j.ecohyd.2024.06.002]
-
Neidermeier AN, West TAP, Verburg PH. 2025. Navigating trade-offs in carbon storage, biodiversity, and wildfire risk in European landscape management. Ecosyst Serv 74: 101751.
[https://doi.org/10.1016/j.ecoser.2025.101751]
-
Nelson E, Mendoza G, Regetz J, Polasky S, Tallis H, Cameron DR, Chan KMA, Daily GC, Goldstein J, Kareiva PM, Lonsdorf E, Naidoo R, Ricketts TH, Shaw MR. 2009. Modeling multiple ecosystem services, biodiversity conservation, commodity production, and tradeoffs at landscape scales. Front Ecol Environ 7: 4-11.
[https://doi.org/10.1890/080023]
-
Park SY, Lee SW, Kim TH, Choi JM. 2020. Seasonal analysis of the relationship between drought intensity and forest fire frequency (in Korean). Geogr J Korea 54(3): 299-309.
[https://doi.org/10.1890/080023]
-
Parks SA, Dillon GK, Miller C. 2014. A new metric for quantifying burn severity: The relativized burn ratio. Remote Sens 6: 1827-1844.
[https://doi.org/10.3390/rs6031827]
-
Parsons A, Robichaud PR, Lewis SA, Napper CO, Clark JT. 2010. Field guide for mapping post-fire soil burn severity. U.S. Department of Agriculture, Forest Service, Rocky Mountain Research Station, Fort Collins, CO.
[https://doi.org/10.3390/rs6031827]
-
Pearson T, Walker S, Brown S. 2013. Sourcebook for land use, land-use change and forestry projects. Washington, DC: World Bank.
[https://doi.org/10.2737/RMRS-GTR-243]
-
Pérez-Cabello F, Montorio R, Alves DB. 2021. Remote sensing techniques to assess post-fire vegetation recovery. Curr Opin Environ Sci Health 21: 100251.
[https://doi.org/10.1016/j.coesh.2021.100251]
-
Schwantes AM, Rauen Firkowski C, Rodriguez PS, Gonzalez A, Fortin MJ. 2024. A comparison of approaches to quantify carbon for ecosystem service assessments through time. FACETS 9: 1-13.
[https://doi.org/10.1139/facets-2023-0053]
-
Selivanov E, Hlaváčková P. 2021. Methods for monetary valuation of ecosystem services: A scoping review. J For Sci 67: 499-511.
[https://doi.org/10.17221/96/2021-JFS]
-
Soontha L, Bhat MY. 2026. Global firestorm: Igniting insights on environmental and socio-economic impacts for future research. Environ Dev 57: 101362.
[https://doi.org/10.1016/j.envdev.2025.101362]
-
Sweeney K, Dittrich R, Moffat S, Power C, Kline JD. 2023. Estimating the economic value of carbon losses from wildfires using publicly available data sources: Eagle Creek Fire, Oregon 2017. Fire Ecol 19: 55.
[https://doi.org/10.1186/s42408-023-00206-2]
-
Syifa M, Panahi M, Lee C-W. 2020. Mapping of post-wildfire burned area using a hybrid algorithm and satellite data: The case of the camp fire wildfire in California, USA. Remote Sens 12: 623.
[https://doi.org/10.3390/rs12040623]