Perception of outdoor heat adaptation facilities varies by age group in Korea
 ; Park, Byeong Jin**
; Jun, So Jin**
; Nam, HyunWoo**
; Zhao, Mengjia*
; Lee, Dongkun***, †
; Park, Byeong Jin**
; Jun, So Jin**
; Nam, HyunWoo**
; Zhao, Mengjia*
; Lee, Dongkun***, †
Abstract
Escalating climate change intensity requires a greater adaptive capacity to urban heat extremes. In response, cities are implementing outdoor facilities to mitigate urban heat and allow pedestrians to engage in outdoor activities during heat events. Local governments in Seoul, South Korea have installed sunshades, street trees, cooling fogs, green walls, and green roofs as climate change adaptation strategies. Previous studies emphasized the importance of preferences and perceptions of users in the effectiveness of urban infrastructure and landscape, and highlighted the impact of age on preferences and perceptions. However, current adaptation planning does not reflect variation across different age groups, nor does it consider user effectiveness; therefore, this study aims to identify variation in perceptions of the adaptive capacity of the five abovementioned outdoor heat adaptation facilities across age groups and to suggest implications for climate change adaptation strategies. To verify the variation, we used the Kruskal-Wallis test, and the results showed that the perception of green roofs varied across six different age groups from 15 to over 65 years old at a 95% confidence interval, and perception of green walls at a 90% confidence interval. Sunshades, street trees, and cooling fogs showed no significant variation across different age groups. Specifically, individuals aged 65 and older perceived green roofs as significantly more effective for adapting to outdoor heat than those aged 15 to 34. Similarly, this older age group found green walls more beneficial than the youngest group, aged 15 to 24. To further explore the relationship of the perception with behavioral features and socio-economic status, we performed correlation analysis. The results suggested that climate change awareness, heat sensitivity, and education could play a significant role in shaping perceptions of adaptive capacity based on outdoor heat adaptation facilities. Perception of high adaptive capacity of green walls and green roofs by older population along with significance of climate change awareness could be used as important information for effective adaptation planning especially in aging society.
Keywords:
Climate Change Adaptation, Perception of Adaptive Capacity, Adaptation Facilities, Outdoor Heat, Survey1. Introduction
Urban centers around the globe are grappling with the increasing impacts of climate change, notably the surge in frequency and intensity of heatwaves. This escalating urban heat stress necessitates robust adaptation strategies to safeguard public health and enhance thermal comfort in outdoor environments. While various outdoor adaptation facilities such as sunshades, street trees, and cooling fogs have been deployed, the effectiveness of these measures in facilitating adaptation to intensified urban heat remains under-explored.
Understanding the perceptions and preferences of the users of these adaptation facilities is crucial for maximizing the utility of urban infrastructure. Research has consistently shown that demographic factors, especially age, play a pivotal role in shaping the perceptions and preferences towards urban infrastructure and landscapes, including green components like green walls and green roofs (Barreira et al., 2023; Marti et al., 2020; Tanaka et al., 2022; Torres et al., 2020; Wamsler et al., 2020). These insights are vital for city planners and policymakers aiming to implement effective heat adaptation strategies.
Barreira et al. (2023) emphasized that residents’ perceptions of green infrastructure significantly influence their support for adaptation measures. Along with geographic properties of respondents’ residence, differing age cohorts may prioritize various facilities based on their unique experiences and values. Similarly, Torres et al. (2020) demonstrated that demographic factors, including age, can affect perceptions and preferences regarding climate adaptation strategies, indicating potential differences in support among younger and older populations.
Research by Wu et al. (2023) further explored public preferences and willingness to pay for ecosystem benefits of urban green infrastructure, revealing significant variation across demographic groups. This reinforces the notion that age-related differences are crucial in determining support for heat adaptation facilities. Additionally, Suppakittpaisarn et al. (2019) highlighted discrepancies between designers’ and laypeople’s preferences for green infrastructure, suggesting that age might influence how different groups value specific adaptation measures.
Moreover, the heterogeneity in preferences, as noted by Macháč et al. (2022), underscores the need to consider demographic factors in understanding public preferences for green and blue infrastructure in urban settings. This body of literature collectively supports our research hypothesis that age will significantly affect the preference for outdoor heat adaptation facilities such as shade, street trees, cooling fog, green walls, and green roofs.
In light of these findings, this study attempts to test a hypothesis that people perceive the effectiveness of adaptation facilities (sunshades, street trees, cooling fogs, green walls, and green roofs) against outdoor heat differently depending on their ages. Current adaptation planning relies on risk assessment based on supply-driven approaches therefore reflecting user perception at a very minimum level. Despite efforts to reflect citizens’ perception and preference by holding workshops and taking surveys, local governments only use them in prioritizing the adaptation risk at macro-levels. At the micro-levels in which risk specific action plans take place within assigned risk sectors, every action plan is only evaluated by its fulfillment rate and does not consider how much citizens, the end-user of each action plan feel effective (Ajou University Industry-Academic Cooperation Foundation, 2022; Seoul Institute, 2022). This is not the particular case only relevant to South Korea. After scrutinizing a body of literatures on global adaptation planning, Drescher and Skoyles (2024) addressed the lack of impact evaluation attributed to methodological limitations primarily relying on surveys and interviews. Hügel and Davies (2020) also highlighted the gap between public engagement and its integration into actual policymaking as it addressed institutional barriers, conceptual ambiguity, and unjust forms of engagement as a wicked problem.
By investigating how different age groups perceive effectiveness of outdoor heat adaptation facilities, planners and policymakers could be able to strategically allocate outdoor heat adaptation facilities with limited financial assets. For instance, when a district has to decide how many and where to install adaptation facilities like sunshades, street trees, or cooling fogs, decision makers will have to assess them based on various supply-driven criteria like expected heat reduction effect, social benefits and volume of pedestrians. Information about how different age groups feel effective about the adaptation facilities could be used as additional demand-driven criterion especially when it comes to choose between areas with similar supply-driven criteria. On a micro scale, we could allocate a specific type of facilities at a certain site if we could pinpoint the locations where specific age groups are prevalent among pedestrians during daytime when heat exposure is at maximum. Although a series of previous studies discovered how various physical environments influence cooling efficiency of heat mitigation or adaptation facilities (Aram et al., 2019; Choi and Lee, 2020; Mohammed et al., 2024), this studies focuses on perceptional aspects of users and how to reflect them in adaptation strategies accordingly.

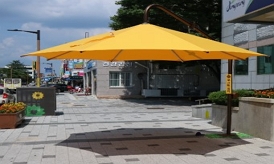
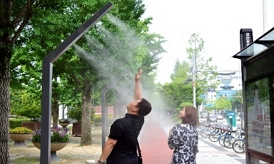
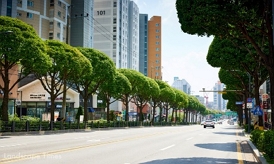
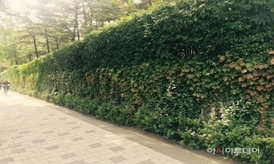
A list of adaptation facilities and brief description of their uses and application site
2. Materials and Methods
We collected the data through an online survey platform called OpenSurvey. The survey targeted a total of 300 residents in Capital area of South Korea, and collected the data for 3 days from 17th to 19th of August, 2024. To answer the main research question to identify variation of perception across different age groups, we divided the sample population by their age spanning from 15 to over 65 years old. And, we designed to separate the age groups by 10 years based on previous studies (Derkzen et al., 2017; Wu et al., 2023; Zhang et al., 2020), making the total number of age groups six: 15-24, 25-34, 35-44, 45-54, 55-64, and 65+. Each age group consisted of 50 individuals with equal percentage of male and female.
This study focused on above five adaptation facilities based on two criteria: 1) Has it been applied at the study site (Capital area of South Korea) as adaptation measure against urban heat 2) Does it have impact on outdoor pedestrians to adapt to heat? Adaptation measures satisfying the both criteria are sunshades, cooling fog, street tree, green roof, and green wall in order of decreasing frequency of application in Capital area of South Korea. We strictly focused on evaluating adaptive capacity of each facility against outdoor heat from pedestrians’ perspective, so that we excluded other influencing factors such as preference of facilities’ exterior design, landscape, and economic impact.
The survey consists of two main sections. The first section is designed to assess the perception of adaptive capacity of each facility against outdoor heat, and the second section is designed to identify socio-demographic and behavioral features corresponding to the perception obtained from the first section.
In the first section, respondents were asked to rate their perception in a Likert scale from one to five for each type of facility on how much it will help them adapt to outdoor heat.
In the second section, respondents were asked to answer six questions on their behavioral features regarding outdoor heat and socio-economic status. Previous studies have explored and examined the correlation and the impact of socio-economic factors such as income, education, vulnerable population, and climate change awareness with or on the perception and preferences of infrastructures (Meyerhoff and Oehlmann, 2023; Rahman, 2017; Suryawan and Lee, 2023; Zhang et al., 2022). Yet, they highlighted the behavioral properties in shaping citizens’ preference, so we added behavioral features in this study to explore particularly the relationship between adaptation behaviors and perception of particular adaptation facilities. For the questions asking their behavioral features, respondents were asked to rate their awareness of how important the climate change issue is and to rate how sensitive they are to heat in a Likert scale from one to five. For the questions asking their socio-economic status, respondents were asked to choose their levels of household income and final education.
To assess the statistical differences in preferences for heat adaptation facilities across different age groups, this study employed the Kruskal-Wallis H Test, a non-parametric method suitable for comparing more than two independent groups. The Kruskal-Wallis H Test is particularly useful in this context as it does not assume a normal distribution of the data. By ranking the data and comparing the distributions across the different age groups, the test determines whether there are statistically significant differences in the median preferences among the groups.
For each of total six age groups, the preferences for five above mentioned outdoor heat adaptation facilities are assessed. If the test indicates significant differences, post-hoc pairwise comparisons will be conducted using Bonferroni test to identify which specific groups differ from each other.
To additionally explore which factors other than age influence the perception of adaptive capacity of outdoor heat adaptation facilities, we asked respondents about their behavioral features and socio-economic status. For behavioral features, we considered climate change awareness and heat sensitivity. For socio-economic status, we considered household income and education (see Table 2).
Description of variables in the survey
It is important to note that the participants’ answers to the questionnaires could be biased based on their past experience of heat events and adaptation facilities. Depending on climate conditions of the date and time when user experienced the facilities, how frequently the users experienced the facilities, and how long the users have been exposed to heat events, their perception and preference of the adaptation facilities could be shaped differently (Barreira et al., 2023; Fang et al., 2007; Guillen et al., 2013; Navas-Martin et al., 2024).
3. Results and Discussion
3.1. Descriptive Statistics
For all age groups, shade is most preferred among 5 facilities, and green wall is least preferred in their adaptive capacity to outdoor heat. The interesting pattern noticed from the variation pattern across different adaptation facilities is that increasing levels of perception with increasing ages are observed only in green facilities: street trees, green wall, and green roof. Another distinguishing observation across different adaptation facilities is that perception on adaptive capacity of cooling fog show distinctively high for the youngest age group (AG1) (see Fig. 1).

Average perception of adaptation facilities across 6 different age groups
Average perception of adaptation facilities across 6 different age groups
3.2. Green Wall and Green Roof Showed Statistical Difference across Age Groups
Kruskal-Wallis H test was conducted to examine whether the preferences for five different heat adaptation facilities varied significantly across six different age groups. The analysis revealed that only green roof and green wall showed statistical difference by age groups at 95% and 90% confidence interval, respectively.
Kruskal Wallis H test
Looking at the distribution of perception of green wall as in Fig. 2, distribution of age group 5 whose age spans from 55 to 65 years old is notably left skewed, concentrating on the high levels of perception.

Violin plot of perception on adaptive capacity of green wall against outdoor heat across six different age groups
For green roof, a similar pattern observed in which the distribution of age group 5 and 6 shows a notably left skewed distribution compared to other age groups (see Fig. 3). To further examine the statistical difference between different age group, we performed a post-hoc test, and the result is shown in the following section.

Violin plot of perception on adaptive capacity of green roof against outdoor heat across six different age groups
3.3. Statistical Difference Exists between the Youngest and the Oldest Groups
A post-hoc Bonferroni test is performed to examine between which different age groups has the significant difference in preference.
Bonferroni post-hoc test in Table 5 showed that the age group 1 and age group 5 & 6 has significant difference in perception of green wall. The older population tends to have higher perception on green wall about its adaptive capacity against heat.
Bonferroni post-hoc test of green wall
Bonferroni post-hoc test in Table 6 showed that the age group 1 & 2 and the age group 5 & 6 has significant difference. The older population tends to have higher perception on green roof about its adaptive capacity against heat.
Bonferroni post-hoc test of green roof
The results presented in Tables 5 and 6 corroborate findings from previous studies, indicating that older populations tend to prefer green infrastructure and landscape features (Tam et al., 2013; Wang et al., 2023; Wu et al., 2023).
Table 7 shows the spearman coefficients between the variables. We explored the spearman correlation coefficient to understand the relationship between variables. At 99% confidence interval, “climate change awareness” showed positive correlation with perception on adaptive capacity of sunshade, street tree, and green roof against outdoor heat. The strength of correlation is the highest for street tree, implying that the higher awareness of climate change more likely to perceive higher adaptive capacity of street tree against outdoor heat. “Heat sensitivity” also showed positive correlation with all the adaptation facilities at 99% and 95% confidence interval except street tree. This might imply that street tree’s high perception of adaptive capacity against heat is attributed to not only physiological sensitivity to heat but also other factors such as frequent exposure to the facilities. Pedestrians could easily encounter street trees compared to cooling fog, green wall, and green roof so that respondents’ answer to score the adaptive capacity of each facility against outdoor heat might be biased to give higher scores to more familiar or experienced facilities. Correlation of preference of infrastructure with users’ familiarity has been discussed in the previous literature (Derkzen et al., 2017; Macháč et al., 2022).
P values of spearman coefficients between the variables
Household income showed weak significance with cooling fog and no significance with any adaptation facility. And level of education showed significant correlation only with green wall. It is important to note that education is a variable highly correlated with age and income especially when the sample in this study includes teenagers under 20s. First of all, income variable used in this study is household income so that teenager’s low income would not explicitly generate bias against the youngest age group unless they don’t have family members to support them. Second, household income (HI) is not correlated with green wall (GR), which rejects the assumption that correlation of education (E) with green wall (GW) is significantly influenced by household income (HI). Foremost, this result aligns with previous research by Zhang et al. (2020), Collins et al. (2017), and Teotónio et al. (2020), which revealed that people with higher educational backgrounds are likely to prefer green walls, more sensitive to ecological value, and more willing to pay for them.
Overall, the way users perceive five different adaptation facilities of their adaptive capacities against heat could be more dependent upon how important they consider of climate change issues and how individually sensitive to heat than their income and education status.
4. Conclusion
The current adaptation planning in South Korea is mainly supply driven and therefore lacks reflecting user demand. Understanding how different group of users perceive and feel effective about adaptation facilities like sunshades, street trees, cooling fogs, green walls, and green roofs is crucial to improve effectiveness of such adaptation strategies.
In light of findings from previous studies, age was a major determinant of perception and preference of urban landscape and infrastructures. Therefore, this study aims to identify variation of perception on adaptive capacity of above mentioned five outdoor heat adaptation facilities and suggest its implication in climate change adaptation strategy. Kruskal-Wallis test result showed that green roof has perception variation across six different age groups from 15 to over 65 years old under 95% confidence interval, and green wall under 90% confidence interval. Sunshade, street tree, cooling fog showed no significant variation across different age groups.
The result corroborates previous studies on green infrastructure and urban landscape favored by older population. As aging population intensifies, this perception of high adaptive capacity of green adaptation facilities as perceived by the older population will have more significant impact on the effective adaptation to outdoor heat. Although such variation of perception between the young and the old groups alone would have limited policy applicability due to spatial heterogeneity of complex urban fabrics, it could work as a useful decision support information to enhance policy effectiveness of adaptation planning. In order to maximize efficacy of our findings, we further need to explore feasibility of application of multiple facilities and verify their combined effects. Combination of multiple adaptation facilities like sunshades, plants, and water droplets could encompass multiple age groups, and therefore enhance user perception and effectiveness of diverse group of people.
Acknowledgments
This work was supported by Korea Environment Industry & Technology Institute (KEITI) through Climate Change R&D Project for New Climate Regime Program, funded by Korea Ministry of Environment (MOE) (RS-2023-00221110). The survey conducted in this research was approved by the Institutional Review Board of the University of Seoul, under approval number UOS IRB 2024-05-019-001.
References
- Ajou University Industry-Academic Cooperation Foundation. 2022. Detailed implementation plan for the 3rd Gyeonggi-do climate crisis adaptation strategy (2022–2026): Final report. Gyeonggi Provincial Government.
-
Aram F, García EH, Solgi E, Mansournia S. 2019. Urban green space cooling effect in cities. Heliyon 5(4).
[https://doi.org/10.1016/j.heliyon.2019.e01339]

-
Barreira AP, Andraz J, Ferreira V, Panagopoulos T. 2023. Perceptions and preferences of urban residents for green infrastructure to help cities adapt to climate change threats. Cities 141: 104478.
[https://doi.org/10.1016/j.cities.2023.104478]
-
Choi Y, Lee S. 2020. The impact of urban physical environments on cooling rates in summer: Focusing on interaction effects with a kernel-based regularized least squares (KRLS) model. Renewable Energy 149: 523-534.
[https://doi.org/10.1016/j.renene.2019.12.021]
-
Collins R, Schaafsma M, Hudson MD. 2017. The value of green walls to urban biodiversity. Land Use Policy 64: 114-123.
[https://doi.org/10.1016/j.landusepol.2017.02.025]
-
Derkzen ML, Van Teeffelen AJA, Verburg PH. 2017. Green infrastructure for urban climate adaptation: How do residents’ views on climate impacts and green infrastructure shape adaptation preferences? Landscape Urban Plann 157: 106-130.
[https://doi.org/10.1016/j.landurbplan.2016.05.027]
-
Drescher M, Skoyles A. 2024. Urban climate change adaptation planning using participatory scenarios: A systematic review of methods and approaches. J Environ Plann Manag: 1-24.
[https://doi.org/10.1080/09640568.2024.2371998]
-
Fang X, Singh S, Ahluwalia R. 2007. An examination of different explanations for the mere exposure effect. J Consum Res 34(1): 97-103.
[https://doi.org/10.1086/513050]
-
Guillen MD, Ishida H, Okamoto N. 2013. Is the use of informal public transport modes in developing countries habitual? An empirical study in Davao City, Philippines. Transp Policy 26: 31-42.
[https://doi.org/10.1016/j.tranpol.2012.03.008]
-
Hügel S, Davies AR. 2020. Public participation, engagement, and climate change adaptation: A review of the research literature. Wiley Interdiscip Rev: Clim Change 11(4): e645.
[https://doi.org/10.1002/wcc.645]
-
Macháč J, Brabec J, Arnberger A. 2022. Exploring public preferences and preference heterogeneity for green and blue infrastructure in urban green spaces. Urban For Urban Greening 75: 127695.
[https://doi.org/10.1016/j.ufug.2022.127695]
-
Martí P, García-Mayor C, Nolasco-Cirugeda A, Serrano-Estrada L. 2020. Green infrastructure planning: Unveiling meaningful spaces through Foursquare users' preferences. Land Use Policy 97: 104641.
[https://doi.org/10.1016/j.landusepol.2020.104641]
-
Meyerhoff J, Oehlmann M. 2023. The performance of full versus partial profile choice set designs in environmental valuation. Ecol Econ 204: 107665.
[https://doi.org/10.1080/21606544.2021.1894990]
-
Mohammed A, Khan A, Khan HS, Santamouris M. 2024. On the cooling energy impacts of combined urban heat mitigation strategies in subtropical urban building environment. Energy Build 309: 113918.
[https://doi.org/10.1016/j.enbuild.2024.113918]
-
Navas-Martín MÁ, Cuerdo-Vilches T, López-Bueno J. A, Díaz J, Linares C, Sánchez-Martínez G. 2024. Human adaptation to heat in the context of climate change: A conceptual framework. Environ Res 252: 118803.
[https://doi.org/10.1016/j.envres.2024.118803]
- Rahman KS. 2017. The new utilities: Private power, social infrastructure, and the revival of the public utility concept. Cardozo L Rev 39: 1621.
- Seoul Institute. 2022. Detailed implementation plan for the 3rd Seoul climate crisis adaptation strategy (2022–2026): Final report. Seoul Metropolitan Government.
-
Suppakittpaisarn P, Jiang B, Slavenas M, Sullivan WC. 2019. Does density of green infrastructure predict preference? Urban For Urban Greening 40: 236-244.
[https://doi.org/10.1016/j.ufug.2018.02.007]
-
Suryawan, IWK, Lee CH. 2023. Citizens’ willingness to pay for adaptive municipal solid waste management services in Jakarta, Indonesia. Sustainable Cities Soc 97: 104765.
[https://doi.org/10.1016/j.scs.2023.104765]
-
Tam J, McDaniels TL. 2013. Understanding individual risk perceptions and preferences for climate change adaptations in biological conservation. Environ Sci Policy 27: 114-123.
[https://doi.org/10.1016/j.envsci.2012.12.004]
-
Tanaka K, Nelson H, McCullar N, Parulekar N. 2022. Citizens’ preferences on green infrastructure practices and their enhancement in Portland, Oregon. J Environ Manag 318: 115415.
[https://doi.org/10.1016/j.jenvman.2022.115415]
-
Teotónio I, Oliveira Cruz C, Matos Silva C & Morais J. 2020. Investing in sustainable built environments: The willingness to pay for green roofs and green walls. Sustainability 12(8): 3210.
[https://doi.org/10.3390/su12083210]
-
Torres MAO, Kallas Z, Herrera SIO. 2020. Farmers’ environmental perceptions and preferences regarding climate change adaptation and mitigation actions; towards a sustainable agricultural system in México. Land Use Policy 99: 105031.
[https://doi.org/10.1016/j.landusepol.2020.105031]
-
Wamsler C, Alkan-Olsson J, Bjorn H., Falck H, Hanson H, Oskarsson T, Zelmerlow F. 2020. Beyond participation: When citizen engagement leads to undesirable outcomes for nature-based solutions and climate change adaptation. Clim Change 158: 235-254.
[https://doi.org/10.1007/s10584-019-02557-9]
-
Wang Y, Yang Y, Sun Y, Lyu S, Zhang Z, Liu D, Wei, S, Liu S, Wang M. 2023. Public perception and preferences of industrial green infrastructure in Northwest China. Ecol Indic 156: 111123.
[https://doi.org/10.1016/j.ecolind.2023.111123]
-
Wu X, Zhang J, Han Y, Zhou N, Qiao XJ, Han C. 2023. Exploring public preference and willingness to pay for the ecosystem benefits of urban green infrastructure: Evidence from a discrete choice experiment of pilot sponge cities in China. Water 15(15): 2767.
[https://doi.org/10.3390/w15152767]
-
Zhang X, Ni Z, Wang Y, Chen S, Xia B. 2020. Public perception and preferences of small urban green infrastructures: A case study in Guangzhou, China. Urban For Urban Greening 53: 126700.
[https://doi.org/10.1016/j.ufug.2020.126700]