
Pursuing green transition only when we can afford it? The impact of growth pressure on carbon intensity through R&D, emissions trading systems, and energy security

Abstract
As more than 90 countries have committed to net-zero emissions, the path toward sustained carbon reduction remains constrained by structural and political challenges. Free-riding incentives and public pressure to prioritize immediate economic growth often undermine decarbonization efforts. This study investigates how growth pressure (GP), measured by economic growth rates, unemployment levels, and fiscal deficits, affects carbon intensity. The analysis uses panel data from 73 countries from 1995 to 2019. A composite GP index was constructed using Z-score standardization and validated through principal component analysis (PCA). The findings reveal several key insights. First, heightened GP arising from adverse economic conditions is significantly associated with increased carbon intensity. Second, GP weakens the carbon-reducing effect of R&D investment by redirecting innovation priorities toward short-term economic and employment gains at the expense of long-term green technologies. Third, the effectiveness of emissions trading systems (ETSs) in lowering carbon intensity diminishes under elevated GP. Finally, the adverse impact of GP on carbon intensity is amplified in countries with poor energy security, reflecting greater vulnerability in their energy infrastructure. These results reveal a fundamental political economy dilemma: the imperative of economic growth frequently overshadows climate commitments. They suggest that maintaining balanced economic expansion is essential for sustaining investment and progress toward net-zero goals. This study contributes to the literature by systematically linking macroeconomic pressures to the fragility of green transition pathways.
Keywords:
Carbon Intensity, Growth Pressure, R&D Investment, ETS, Energy Security, Panel Analysis1. Introduction
In response to climate change, nearly 200 countries joined the Paris Climate Accord, creating a global framework for carbon reduction. Since the 2021 Glasgow Conference, countries have announced ambitious net-zero goals: the U.S., EU, Japan, Iran, and South Korea by 2050; China and Russia by 2060; and India by 2070. Reducing carbon intensity, emissions per GDP unit is essential to decoupling economic growth from emissions. The environmental Kuznets curve (EKC) suggests that economic growth is necessary for emissions reduction, mainly in developed nations benefiting from energy efficiency, industrial shifts, and carbon-reduction technologies (Purdey, 2010; Shafik, 1994). However, decoupling remains limited in developing and manufacturing-heavy economies, where aggressive carbon policies increase energy and production costs, raise carbon prices, and constrain output.
These strong efforts on carbon reduction are likely to dampen the manufacturing industry, hindering economic growth and increasing unemployment, resulting in dissatisfaction of the public. In particular, the carbon reduction effort is not of great interest to the public because the benefits of carbon reduction by mitigating climate change occur far in the future, are uncertain, and are not specific. In contrast, the costs of carbon reduction occur in the present, are certain, and cause specific pain. For this reason, the average public prioritizes economic growth over carbon reduction, and so do politicians. This aspect can be considered a political reason why consistent investment in carbon reduction action is difficult, especially when economic indicators that significantly affect the public, such as the economic growth rate, unemployment rate, or fiscal deficit, are negative.
The psychological and political roots of this dilemma can be explained through the lens of risk perception. As identified by Daniel Gilbert at Harvard University, individuals recognize crises more effectively when they are personal, abrupt, immoral, and happening now. Economic crises, manifesting as sudden unemployment or fiscal deficits, align closely with these attributes. In contrast, the climate crisis is often perceived as a distant and uncertain threat, leading the public and politicians to prioritize immediate growth over carbon reduction (Paniello-Castillo et al., 2025). This dynamic generates intense GP, which incentivizes governments to weaken environmental regulations and reduce green investments to protect current production.
In addition, as is well known, the cost of carbon reduction is borne private and directly by countries. However, the benefits of climate change mitigation have characteristics of a public good because they are non-exclusive and non-competitive; therefore, there is an incentive to freeride the benefits of other countries’ climate change mitigation efforts. This can be considered as a structural reason that global carbon reduction effort is often difficult to achieve.
In a situation of low economic growth, high unemployment rate, and severe fiscal deficit, these political and structural reasons cause strong incentives to weaken the carbon reduction efforts. A famous example is when the U.S. withdrew from the Paris climate accord in 2017. The following is part of the statement that the U.S. president made when announcing withdrawal.
“By 2040, compliance with the commitments put into place by the previous administration would cut production for the following sectors: paper down 12%; cement down 23%; iron and steel down 38%; coal— and I happen to love the coal miners—down 86%; and natural gas down 31%. The cost to the economy at this time would be close to $3 trillion in lost GDP and 6.5 million industrial jobs, while households would have $7,000 less income and, in many cases, much worse than that.”
The U.S. economic growth rate in 2016 was 1.67%, which was the lowest in the previous five years. This resulted in GP, and Trump’s claim that climate change efforts do not help boost economic growth and the unemployment rate received much support during the presidential election that took place in the same year. This example is not a unique one to the U.S. but occurs in many other countries to some extent, especially in 2023 when the instability of international energy market creates severe inflation and economic uncertainty due to Russia-Ukraine war and Israel-Palestine war.
The U.S. withdrawal exemplifies the macroeconomic GP driven by recessionary conditions. Conversely, the subsequent case of Germany underscores a related yet analytically distinct aspect of energy-cost-driven pressures arising from import dependence, which the study addresses independently through the energy-security channel.
Germany, renowned for its export-driven economy and manufacturing prowess, exemplifies the dilemmas posed by GP in balancing economic expansion and environmental priorities. Following the 2022 energy crisis triggered by the Russia-Ukraine war, German industries faced soaring energy costs, with natural gas prices increasing by over 300% compared to pre-crisis levels. Energy-intensive sectors like steel and automotive manufacturing were particularly affected, as companies such as BASF (Badische Anilin- und Soda-Fabrik) announced plans to scale back production in Germany due to unsustainable operational costs. At the same time, the government’s ambitious Energiewende (energy transition) policies, including the accelerated phase-out of coal by 2030, have added to the burden by increasing compliance costs. These pressures have ignited debates between industry advocates calling for delayed environmental measures to preserve jobs and policymakers aiming to uphold Germany’s commitments to the Paris Climate Agreement. The resulting tension highlights the trade-offs inherent in pursuing economic stability alongside stringent climate goals.
The U.S. and German cases above thus motivate two distinct components of our framework: the former pertains to the direct ZGP channel (H1–H3), while the latter for the moderating role of energy security (H4). The overarching research framework (Figure 1), as depicted in the conceptual diagram, is predicated on the assertion that GP serves as a principal catalyst for the increase in carbon intensity.
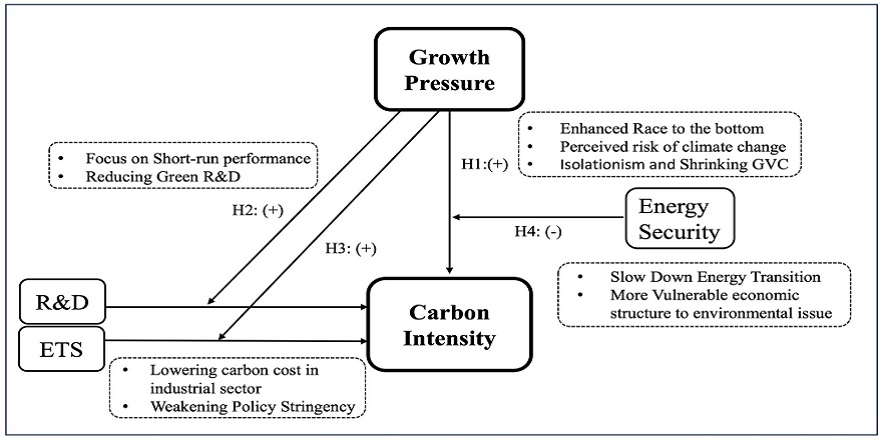
Framework of the study
2. Literature review
In recent years, researchers have paid increased attention to the concept of GP, specifically considering its impact on sustainable development and environmental quality. Several studies have explored the relationship between GP and environmental performance (De Bruyn et al., 1998; Fodha and Zaghdoud, 2010; Yang et al., 2022). Some scholars argue that rapid economic growth can lead to environmental degradation (Ali et al., 2021; Jamel et al., 2016). In contrast, others claim that growth can foster environmental improvement through technological progress and increased resources for protection (Han et al., 2025). At the same time, increases in economic growth goals can weaken the intensity of environmental regulation (Hamlyn, 2024; Li et al., 2021). Local governments are under great pressure to grow when economic expansion is a priority. Consequently, this prompts local officials to relax environmental regulations and firms to reduce environmental investments (Wang et al., 2017, 2022).
Recent studies indicate that GP can lead to resource reallocation. Adomako and Tran (2024) examine the constraints imposed by monetary policy and the macroeconomic environment on green innovation; Zhang et al. (2025) investigate the impact of economic policy uncertainty on corporate green innovation behavior. Hua et al. (2023) observed that during periods of intense economic demand, funds are often diverted from long term green R&D to address immediate industrial needs.
Market based instruments, specifically Emissions Trading Systems (ETS), are designed to internalize the costs of pollution and incentivize low carbon transitions. In the short term, it creates pressures for creative destruction, compelling the economy to break free from its path dependence on cheap, high-carbon energy (Considine and Larson, 2012). In the long term, it guides innovation and investment through market signals, aiming to achieve the decoupling of economic growth from carbon emissions (Ko et al., 2021). Thomsen (2025) examines how environmental regulations affect competitiveness and carbon leakage through the competing lenses of the pollution haven hypothesis (regulations raise costs, undermining competitiveness) and the Porter hypothesis (regulations spur green innovation), directly relevant to the tension between economic goals and regulatory intent.
The relationship between energy security and economic growth has been analyzed, emphasizing the importance of efficient energy use in enhancing energy security and fostering economic growth in OECD countries (Fu et al., 2021). Additionally, various viewpoints on the impact of energy security on carbon productivity have been investigated. According to Kartal's (2022) study, a 1% increase in energy security risk reduces economic growth by roughly 0.66%, while a 1% rise in exports boosts economic growth by 0.41%. Energy security acts as a crucial foundation for economic growth, yet economic expansion continually exerts pressure on energy security (Anancharoenkij and Chinnakum, 2021). Variations in energy prices directly affect inflation and corporate expenses, which in turn influence economic growth rates (Batten et al., 2023).
Most studies focus on single countries or regions and rely on single-dimensional measures of economic pressure (e.g., GDP growth alone). This study aims to fill these literature gaps by providing a comprehensive analysis of these moderating effects. The main contributions of this paper are twofold. First, this study constructs an integrated analytical framework that systematically examines the moderating role of GP on three key carbon reduction channels: R&D, ETS, and energy security within a single empirical model. Second, this study develops a composite GP Index encompassing the GDP growth rate, unemployment rate, and fiscal surplus rate, following Li and Guo (2020) and Chen et al. (2021). Therefore, this study aims to identify the relationship between the elements that influence partial carbon intensity through the following four hypotheses:
Hypothesis 1: High growth pressure leads to an increase in carbon intensity.
Hypothesis 2: High growth pressure weakens the beneficial effects of R&D in reducing carbon intensity.
Hypothesis 3: High growth pressure undermines the role of ETS on reducing carbon intensity.
Hypothesis 4: High energy security reduces carbon intensity and mitigates the impact of growth pressure on carbon intensity.
3. Methodology
3.1. Defining growth pressure index
The GP index (ZGP) used in this study is constructed through the standardization of three critical economic indicators: the GDP growth rate, the fiscal surplus ratio, and the unemployment rate. To neutralize scale effects and preserve the relative volatility of these heterogeneous variables, we apply a Z-score transformation to each component.
To ensure that the results are not contingent upon the specific weighting method, we further validate this construction using Principal Component Analysis (PCA). The applicability of the sample for factor extraction is confirmed by a Kaiser-Meyer-Olkin (KMO) value of 0.536 (shown as Tab.1), which meets the recognized threshold for statistical adequacy. The PCA identifies one primary component with an eigenvalue of 1.243, which explains 41.45 percent of the total variance. Scoring coefficients indicate that fiscal surplus ratio (0.6533) and GDP growth rate (0.5328) carry the most significant weights in this data driven component.

The result of PCA
A comparison between the theory-based Z-score index and the data driven PCA component reveals a significant positive correlation of 0.427 (p<0.01). While this correlation confirms that both methods capture a shared underlying dimension of economic stress, this study maintains the Z-score composite as the primary variable for several reasons.
First, the equal weighting scheme offers superior policy interpretability and aligns with established methods for constructing multidimensional development indices. Second, the relatively moderate KMO value suggests that while factor analysis is valid, the internal correlation structure may not be strong enough to justify abandoning a theory driven measurement in favor of a purely statistical one. Third, the Z-score approach ensures cross country consistency, as the weights remain stable across different national samples rather than being sensitive to the specific covariance structure of the dataset. Since the Z-Score allows for the incorporation of outliers and thus disproportionately affects the mean, the three sub-indicators were truncated at 95% under normal distribution in this case.
| (1) |
The X-axis in Figure 2 shows the standardised measure of economic indicators as Z-scores. The Y-axis provides an estimate of the probability density of the data at different Z-scores, indicating how common or rare certain standardised values are in the data set. Prior to standardization, the three sub-indicators of GP were winsorized at the 2.5th and 97.5th percentiles, such that extreme observations beyond the 95% normal-distribution interval (±1.96σ) were replaced with the corresponding cutoff values rather than excluded from the sample. This procedure was intended to reduce the influence of country-specific outliers, such as Zimbabwe’s hyperinflation episode in 2008, on the Z-score transformation. The robustness check reported in Table B1 of the Appendix shows that the signs of the main coefficients remain unchanged when winsorization is not applied, suggesting that the baseline results are not sensitive to this treatment.
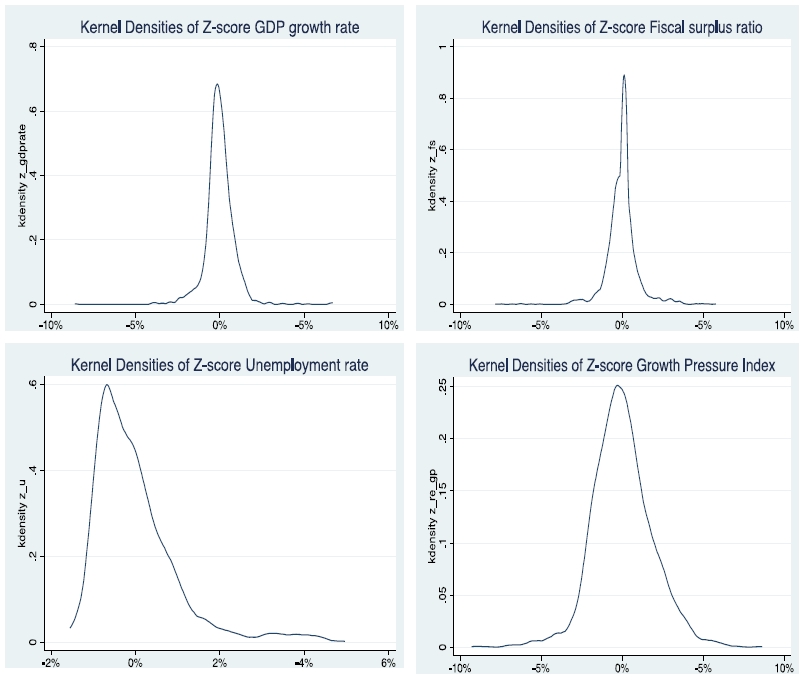
Standardized distributions of sub-indicators and composite growth pressure index
While the equal-weighting Z-score scheme implemented in this study provides transparency, comparability, and interpretability for policy purposes, it is important to recognize that the political significance of the three sub-indicators is unlikely to be uniform across different countries. Variations in political institutions (e.g., electoral cycles, the bargaining power of organized labor), welfare-state regimes, and fiscal frameworks can lead to policymakers in certain economies being disproportionately responsive to one indicator compared to the others. To mitigate this concern, we conduct subsample analyses based on OECD and non-OECD classifications in Section 5, which reflect broad institutional heterogeneity.
3.2. Data
Table 1 shows the descriptive statistics of the data used in this study. The dataset comprises various economic and environmental indicators for 73 countries from 1995 to 2019. Data is mainly from the World Bank, with GDP values adjusted to 2015 purchasing power parity (USD) terms. Energy security (ES) is the proportion of net energy exports among total energy consumption (Luty et al., 2023).
Descriptive statistics
In literature, R&D expenditure and patent counts in the environmental technology field are widely used to measure the technology innovations. The former is generally regarded as the input of innovations activity while the latter is taken as the output. A compelling rationale for adopting the patent-based cumulative stock measure over the input-side R&D expenditure metric is the issue of data availability. Comprehensive and consistent annual R&D expenditure series for non-OECD countries since 1995 exhibit limited coverage and irregular reporting frequencies. This limitation would confine the analysis predominantly to OECD member states, thereby undermining the global scope of the investigation undertaken in this study. In contrast, patent application data are accessible in a balanced manner across all 73 sample countries from 1995, enabling the uniform application of the perpetual-inventory accumulation method outlined in Equation (2).
| (2) |
Where δ is the decay rate (0.1) which reflects the degree that old inventions are replaced by new innovations (Du and Li, 2019), where , is average growth rate.
3.3. Econometric model
The main dependent variable in this study, carbon intensity (CI), is applied in the model as (3), where CIr is defined as the rate of change of CI in year t based on the initial value of CI in 1995 for each country. The use of CIr in the model has two advantages. First, it normalizes each country based on its CI level in 1995, so that the analysis is not affected by scale effects. Secondly, CIr reflects the improvement or deterioration of carbon intensity: a CIr greater than zero indicates a worsening of carbon intensity; conversely, an improvement in carbon intensity. In this sense, the CIr can be interpreted as an index of the decoupling between economic growth and carbon emissions.
| (3) |
We select 1995 as the common base year instead of utilizing a chain-based growth rate because our hypotheses pertain to the cumulative decarbonization trajectory influenced by sustained GP, rather than year-on-year fluctuations. Furthermore, 1995 is the earliest year for which CI data are jointly available for all 73 sample countries, and it immediately precedes the adoption of the Kyoto Protocol in 1997.
Equation (4) shows the general panel model applied in this study. Xit represents the main variables in the four hypotheses, i.e., GP index, R&D investment, ETS, and ES. Ait represents the interaction term. Zit is a vector of control variables that separates the impact from other influencing variables. ϵit is the random error. Both the fixed effect (FE) and random effect (RE) models are conducted to check the robustness of estimation.
| (4) |
4. Results
4.1. GP vs CIr
Table 3 presents the baseline regression results regarding the impact of ZGP on CIr. This positive relationship reflects the prioritization of immediate economic stability over long term environmental objectives. When nations face high GP, policymakers are incentivized to implement short term economic stimuli that often rely on carbon intensive industrial activities. The environmental agenda is effectively sidelined as survival becomes the primary national objective.
The impact of GP on carbon intensity rate
It should be noted that the relatively low R-squared values reported in several fixed-effects specifications do not necessarily imply that the estimated relationships lack reliability. The purpose of this study is not to maximize the predictive power of changes in carbon intensity but to the marginal effects of GP and its interactions with key decarbonization instruments. Given that the dependent variable is defined as a fixed-base cumulative change in carbon intensity relative to 1995, much of the cross-country variation is intentionally mitigated. Furthermore, the inclusion of country and year fixed effects accounts for time-invariant national characteristics and common global shocks, which can mechanically diminish the reported explanatory power within the model. More critically, the signs and significance of the core coefficients demonstrate qualitative consistency across various methodologies, including fixed-effects, random-effects, System GMM, alternative dependent variable specifications, outlier treatment robustness checks, the EU-ETS subsample, and analyses of OECD/non-OECD heterogeneity.
4.2. GP vs R&D
Due to the limitation of our data, which captures only the total R&D stock without the capability to directly differentiate between green and non-green R&D, the positive interaction term presented in Table 4 should be interpreted as providing indirect rather than direct evidence of a structural shift in research priorities. While our primary measurement utilizes total patent stock, the diminishing marginal effect of R&D on carbon reduction under high GP implies a substitution effect between different R&D types.
The impact of R&D investment on carbon intensity rate under the GP
Green R&D projects are characterized by longer gestation periods, higher risk profiles, and a greater reliance on government environmental subsidies. When GP intensify, particularly due to fiscal deficits and rising unemployment, policymakers and firms prioritize a survival first approach. This leads to a strategic reallocation of limited capital, diverting resources from long-term, decarbonization-focused green R&D to productivity-enhancing R&D that can deliver immediate industrial output and protect existing jobs. As a result, the overall R&D pool becomes less green in its composition. We recognize, however, that a conclusive evaluation of this composition-shift mechanism necessitates disaggregated data that differentiates environmental-technology R&D from general R&D. Such data may include OECD REGPAT green patents, PATSTAT Y02 climate-mitigation classifications, or firm-level green R&D expenditures, which are not encompassed within the current country-level panel analysis.
4.3. GP vs ETS
Table 5 reveals that GP compromises the efficacy of the ETS. This supports Hypothesis 3 and highlights two potential mechanisms. First, a sluggish economy reduces industrial demand for carbon credits, leading to a surplus of allowances and a subsequent collapse in carbon prices, which weakens the incentive for firms to invest in cleaner technologies. Second, governments under GP may resort to regulatory capture or policy relaxation, such as issuing additional free allowances, to alleviate the financial burden on domestic industries. To further validate our findings, we re-estimate the same specification across the 26 EU-ETS member countries, exploiting the pre- and post-2005 variation within this institutionally homogeneous group as a generalized difference-in-differences design. The sample window from 1995 to 2019 encompasses both the pre- and post-ETS periods within this group. The attenuation effect not only persists but also intensifies, with the estimated coefficient (gp×ets) equal to -0.025. Comprehensive results are presented in Appendix A.
The impact of ETS on carbon intensity rate under the GP
4.4. GP vs ES
Table 6 illustrates the relationship between energy security and carbon intensity. The significantly negative primary effect of ES confirms the initial component of Hypothesis 4: countries characterized by higher net energy exports tend to exhibit long-term carbon intensity trajectories that are systematically more favorable. This phenomenon reflects the structural advantages associated with stable and diversified energy systems, which facilitate sustained investments in energy efficiency and low-carbon infrastructure.
The impact of energy security on carbon intensity rate under the GP
The asymmetry between the large main effect of ES and the small moderating coefficient reflects the highly skewed distribution of ES in our sample (skewness = 3.75; 78% of observations are net importers clustered near the lower bound, while fewer than 9% are high-export countries). A select group of resource-rich net exporters (e.g., Norway, Canada, Australia) benefits from an exogenously stable energy foundation that underpins their decarbonization trajectories. The comparatively smaller moderating coefficient suggests that, within this predominant group of importers, energy security does not serve as an independent buffer against GP. Energy-importing economies encounter challenges in leveraging energy security as a counter-cyclical instrument when faced with intensified GP; instead, their vulnerability to import dependence and energy price volatility implies that GP and energy insecurity tend to deteriorate concurrently. Consequently, the two coefficients convey complementary aspects of the vulnerabilities inherent to energy importers: a disadvantage in long-term carbon intensity outcomes and a structural incapacity to utilize energy security as a mitigating factor within the country when GP escalates. This dual pattern aligns precisely with the empirical expectations outlined in Hypothesis 4.
4.5. Mediation analysis
While the moderation analysis in preceding sections reveals how GP interferes with the efficacy of R&D and ETS, it offers a relatively static view of environmental policies as passive recipients of economic shocks. The inclusion of mediation analysis is necessitated by the potential endogeneity and feedback loops between economic performance and environmental policy.
Table 7’s mediation analysis highlights the proactive roles of R&D and the ETS in mitigating systemic pressures. Approximately 34.6% of R&D's contribution to emissions reduction is achieved indirectly through enhanced productivity and economic stabilization, while the ETS generates a 4.7% indirect reduction effect via structural optimization. In contrast, the impact of energy security on carbon intensity is primarily direct and structural, with its mediating effect not statistically significant. Collectively, these findings demonstrate that effective environmental policy tools not only reduce carbon intensity through technological means but also serve as economic stabilizers.
The mediating role of R&D, ETS and energy security in GP and carbon intensity
5. Robustness test and heterogeneity analysis
To address potential endogeneity arising from reverse causality between GP and carbon intensity, we employ the system GMM estimator as a robustness check, as shown in Table 8. The significant lagged dependent variable across all specifications confirms substantial path dependence in carbon intensity trajectories, justifying the use of a dynamic panel approach. More importantly, the core findings remain qualitatively consistent with the baseline estimates. The Hansen test statistics confirm instrument validity across all four specifications (p > 0.10), and the number of instruments remains well below the number of groups, mitigating concerns about instrument proliferation. The consistency between the GMM and FE results suggests that our main findings are not materially affected by endogeneity bias.
GMM results
To verify the consistency of our findings, we re-estimated the baseline models using energy intensity (EI) as an alternative dependent variable, as energy use remains the primary driver of global carbon emissions. The results presented in Table 9 indicate that the core relationships identified in the carbon intensity analysis remain robust.
The impact of R&D, ETS, and ES on energy intensity under the GP
The impact of GP and the effectiveness of decarbonization tools exhibit distinct patterns when the sample is divided into OECD and non-OECD countries. For OECD nations, the direct impact of GP on carbon intensity is relatively moderate, as evidenced by the smaller coefficients across models in Table 10. While the ETS remains highly effective in these developed economies, the interaction terms are generally insignificant. This suggests that the advanced institutional frameworks and diversified energy infrastructures in OECD countries provide a degree of resilience, allowing their climate policies to remain relatively stable even during periods of economic fluctuation.
The impact of R&D, ETS, and ES in OECD countries on carbon intensity rate under GP
In contrast, non-OECD countries demonstrate a significantly higher vulnerability to economic stress. As shown in Table 11, the coefficient for GP in these economies is consistently larger and highly significant, reflecting a heavier reliance on carbon intensive sectors for economic recovery. Furthermore, while energy security plays a vital direct role in non-OECD countries, the overall findings suggest that the environmental goals of emerging economies are more easily sidelined by immediate growth imperatives. This heterogeneity highlights the necessity for tailored international support to help developing nations maintain their green transition during economic downturns.
The impact of R&D, ETS, and ES in Non-OECD countries on carbon intensity rate under GP
6. Conclusion
This study examines the influence of GP on carbon intensity and its moderating role in determining the effectiveness of key decarbonization instruments, utilizing panel data from 73 countries spanning the years 1995 to 2019. Through fixed effects, system GMM, alternative dependent variables, and multiple robustness checks, four primary findings are identified. First, GP significantly elevates carbon intensity, indicating that economic anxiety systematically undermines the green transition. Second, it diminishes the carbon-reducing impact of R&D investment by promoting the reallocation of resources from long-term green innovation to short-term productivity enhancements. Third, the efficacy of emissions trading systems is diminished under economic stress, as weakened carbon prices and regulatory relaxation diminish market incentives for decarbonization. Fourth, energy security acts as a strategic buffer; countries with stable and diversified energy systems are better positioned to maintain environmental commitments during economic downturns.
These findings hold substantial policy implications. Most fundamentally, economic growth and carbon reduction should not be regarded as distinct policy domains. Given that GP can undermine the very instruments designed to facilitate decarbonization, such as R&D and ETS, climate policy frameworks must incorporate countercyclical safeguards. Governments should safeguard green R&D budgets during economic downturns, implement price floors in emissions trading systems, and establish automatic stabilizers to mitigate the risk of regulatory rollback under fiscal strain. The heterogeneity analysis further suggests that international climate governance should differentiate between OECD and non-OECD contexts. While advanced economies benefit from enhanced institutional resilience, developing nations require more targeted financial and technical assistance to sustain green transitions amid economic vulnerability.
The results are particularly pertinent to South Korea’s energy transition strategy. The 11th Basic Plan for Long-Term Electricity Supply and Demand and the National Framework Plan for Carbon Neutrality and Green Growth emphasize carbon-free energy, grid expansion, energy storage systems (ESS), offshore wind, and industrial support related to RE100. Our findings suggest that these policies should be more explicitly connected to industrial competitiveness in sectors such as batteries, hydrogen, offshore wind supply chains, power grids, and storage systems, positioning the energy transition not merely as regulatory compliance but as a strategy for economic growth. Concurrently, Phase 4 of Korea's ETS should ensure a stable carbon price signal even during periods of economic stress by closely aligning free allocation and transition support with measurable decarbonization efforts. Given Korea's significant reliance on fossil fuel imports, the integration of distributed energy, regional renewables, ESS, and microgrids into a comprehensive energy security strategy is essential to enhance the resilience of carbon neutrality.
Several limitations warrant consideration. First, while the GP index is validated using PCA, it assigns equal weights to GDP growth, unemployment, and fiscal balance, which may not adequately capture their varying political significance across institutional contexts. Future research could develop heterogeneous or regime-specific weights informed by factors such as partisan orientation, electoral cycles, and labor market institutions.
Second, our measure of R&D does not differentiate between green and non-green innovation. Consequently, the assertion that GP diverts resources away from green R&D relies on indirect inference from interaction terms and prior literature rather than direct observation. Future studies could directly test this mechanism using OECD REGPAT, PATSTAT Y02 classifications, or firm-level green patent data. Additionally, our cumulative patent-based R&D stock reflects innovation output rather than expenditure input; while related, these concepts are not equivalent and may diverge across countries with differing patenting behaviors and innovation efficiencies. Due to the limited availability of comparable panel data on R&D expenditure for many non-OECD countries since 1995, cross-validation with expenditure-based measures is reserved for future research as longer time series, such as World Bank GERD and OECD MSTI-ANBERD, become accessible.
Third, the binary ETS variable captures only the existence of carbon trading and does not account for variations in policy design, stringency, or carbon price levels. Constructing a continuous country-year measure poses challenges, as many major ETSs operate at the sub-national level, including RGGI, California, and China's pilot schemes, and because these systems vary significantly in structural design, encompassing cap-and-trade versus baseline-and-credit frameworks and absolute caps versus intensity targets. Future research could address this by aggregating sub-national price and coverage data from the World Bank Carbon Pricing Dashboard, utilizing the carbon-price component of the OECD Environmental Policy Stringency Index, or separately identifying key design features such as free allocation shares and sectoral coverage. Furthermore, the analysis does not incorporate direct measures of institutional quality, such as government effectiveness, regulatory quality, and rule of law, which may influence both the feasibility of countercyclical climate policy and the efficacy of decarbonization under GP. Finally, the sample concludes in 2019, thereby excluding the COVID-19 pandemic, the subsequent energy crisis, and the post-2022 restructuring of global energy markets. The extent to which these disruptions intensify or mitigate the growth-pressure-decarbonization relationship remains an open empirical question.
Ultimately, this study highlights a fundamental paradox in global climate governance: the green transition is often most susceptible to disruption precisely when it is most essential. Economic downturns not only elevate carbon intensity directly but also compromise the policy frameworks designed to mitigate it. Achieving net-zero objectives therefore necessitates not only robust climate policies but also those that are resilient to the economic uncertainties of a volatile global economy.
References
-
Adomako S, Tran MD. 2024. Exploring the effect of R&D support, green technology transfer, sustainable innovation. Sustainable Dev 32(5): 4758-4769.
[https://doi.org/10.1002/sd.2936]

-
Ali A, Audi M, Roussel Y, Ali A, Audi, M. 2021. Natural resources depletion, renewable energy consumption and environmental degradation: A comparative analysis of developed and developing world. Int J Energy Econ Policy 11(3): 251-260.
[https://doi.org/10.32479/ijeep.11008]
-
Anancharoenkij T, Chinnakum W. 2021. Energy security, economic growth, and poverty reduction: Empirical evidence from selected ASEAN member states. In Poverty reduction for inclusive sustainable growth in developing Asia. Singapore: Springer Singapore. p. 185-209.
[https://doi.org/10.1007/978-981-16-1107-0_9]
-
Batten JA, Mo D, Pourkhanali A. 2023. Can inflation predict energy price volatility? Energy Econ 129: 107158.
[https://doi.org/10.1016/j.eneco.2023.107158]
-
Chen X, Ke Y, Li H. 2021. Does the promotion pressure on local officials matter for regional carbon emissions? Evidence based on provincial-level leaders in China. Environ Geochem Health 44: 2881-2903.
[https://doi.org/10.1007/s10653-021-01050-6]
-
Considine T, Larson DF. 2012. Short term electric production technology switching under carbon cap and trade. Energies 5(10): 4165-4185.
[https://doi.org/10.3390/en5104165]
-
De Bruyn SM, Bergh JC, Opschoor JB. 1998. Economic growth and emissions: reconsidering the empirical basis of environmental Kuznets curves. Ecological Economics, 25(2), 161-175.
[https://doi.org/10.1016/S0921-8009(97)00178-X]
-
Du K, Li J. 2019. Towards a green world: How do green technology innovations affect total-factor carbon productivity. Energy Policy 131: 240-250.
[https://doi.org/10.1016/j.enpol.2019.04.033]
-
Fodha M, Zaghdoud O. 2010. Economic growth and pollutant emissions in Tunisia: An empirical analysis of the environmental Kuznets curve. Energy Policy 38(2): 1150-1156.
[https://doi.org/10.1016/j.enpol.2009.11.002]
-
Fu F, Alharthi M, Bhatti Z, Sun L, Rasul F, Hanif I, Iqbal W. 2021. The dynamic role of energy security, energy equity and environmental sustainability in the dilemma of emission reduction and economic growth. J Environ Manage 280: 111828.
[https://doi.org/10.1016/j.jenvman.2020.111828]
-
Hamlyn O. 2024. Economic imaginaries and environmental regulation. Mod Law Rev 87(5): 1258-1293.
[https://doi.org/10.1111/1468-2230.12889]
-
Han S, Peng D, Guo Y, Aslam M, Xu R. 2025. Harnessing technological innovation and renewable energy and their impact on environmental pollution in G-20 countries. Sci Rep 15(1): 2236.
[https://doi.org/10.1038/s41598-025-85182-0]
-
Hua J, Gao J, Chen K, Li J, 2023. Driving effect of decoupling provincial industrial economic growth and industrial carbon emissions in China. Int J Environ Res Public Health 20(1): 145.
[https://doi.org/10.3390/ijerph20010145]
-
Jamel L, Derbali A, Jamel L, Derbali A. 2016. Do energy consumption and economic growth lead to environmental degradation? Evidence from Asian economies. Cogent Econ Finance 4(1): 1170653.
[https://doi.org/10.1080/23322039.2016.1170653]
-
Kartal G. 2022. The relationship between energy security, exports and economic growth: The case of the middle east countries. Turk J Middle East Stud 9(1): 15-45.
[https://doi.org/10.26513/tocd.899337]
-
Ko I, Lee T, Ko I, Lee T. 2021. Carbon pricing and decoupling between greenhouse gas emissions and economic growth: A panel study of 29 European countries, 1996–2014. Rev Policy Res 39(5): 654-673.
[https://doi.org/10.1111/ropr.12458]
-
Li F, Wang Z, Huang L, Li F, Wang Z, Huang L. 2021. Economic growth target and environmental regulation intensity: Evidence from 284 cities in China. Environ Sci Pollut Res 29(7): 10235-10249.
[https://doi.org/10.21203/rs.3.rs-442311/v1]
-
Li Q, Guo M, 2020. Local economic performance, political promotion, and stock price crash risk: Evidence from China. Emerging Markets Finance Trade 57(15): 4330-4349.
[https://doi.org/10.1080/1540496X.2020.1809373]
-
Luty L, Zioło M, Knapik W, Bąk I, Kukuła K. 2023. Energy security in light of sustainable development goals. Energies 16(3): 1390.
[https://doi.org/10.3390/en16031390]
-
Paniello-Castillo B, Döring S, Dryhurst S, Di Baldassarre G, Raffetti E. 2025. Risk perception of climate change and global crises: Influences of socio-economic drivers and political orientations. Humanit Soc Sci Commun 12(1): 1-9.
[https://doi.org/10.1057/s41599-025-05349-y]
-
Purdey SJ. 2010. Economic growth, the environment and international relations: The growth paradigm. London: Routledge.
[https://doi.org/10.4324/9780203863398]
-
Shafik N. 1994. Economic development and environmental quality: An econometric analysis. Oxford Econ Pap 46(Supplement 1): 757-773.
[https://doi.org/10.1093/oep/46.Supplement_1.757]
-
Thomsen SF. 2025. The impact of environmental regulations on competitiveness and carbon leakage: The pollution haven and Porter hypothesis in a two-area ecological stock-flow consistent model. Eur J Econ Policies: Intervention 22(3): 454-479.
[https://doi.org/10.4337/ejeep.2024.0140]
-
Wang R, Zhang Q, Wang R, Zhang Q. 2017. Local governments’ fiscal pressure and the dependence on polluting industries in China. China & World Econ 25(4): 109-130.
[https://doi.org/10.1111/cwe.12209]
-
Wang T, Fu Q, Wang Y, Gao M, Chen J. 2022. The interaction mechanism of fiscal pressure, local government behavioral preferences and environmental governance efficiency: Evidence from the Yangtze River Delta Region of China. Int J Environ Res Public Health 19(24): 16618.
[https://doi.org/10.3390/ijerph192416618]
-
Yang Z, Gao W, Li J. 2022. Can economic growth and environmental protection achieve a “win–win” situation? Empirical evidence from China. Int J Environ Res Public Health 19(16): 9851.
[https://doi.org/10.3390/ijerph19169851]
-
Zhang L, Luo Z, Yu X, Yang Q, Wang J. 2025. Economic policy uncertainty and corporate green innovation. Int Rev Financ Anal 97: 103797.
[https://doi.org/10.1016/j.irfa.2024.103797]
Appendix
Appendix
A. Additional robustness check: EU-ETS subsample
The impact of ETS on carbon intensity rate under GP — EU-ETS subsample (26 countries, 1996–2019)
B. Robustness test for outlier truncation
Comparison of key results under different truncation strategies
C. Robustness test for alternative CIr baseline
Robustness check using the 1995–1997 average as the baseline for CIr